


- SOL trades at $85.64, up 2.06%, pushing toward the 0.382 Fib at $84.74 with the 50-day EMA at $86.21 as the next resistance.
- Polymarket gives 70% odds SOL hits $90 in May, 24% for $100, with 64% pricing a $80 close as the most consensus downside.
- Solana pulled $381M in ecosystem inflows over three months with 69% sourced from Ethereum, per Artemis data.
Solana trades at $85.64 on May 4, up 2%, with Polymarket’s monthly market pricing 70% odds of a $90 close in May and on-chain data showing $381M in ecosystem inflows over the past three months, 69% of which came from Ethereum.
SOL Daily Chart: Fibonacci Resistance Stacks Up At $86 To $90
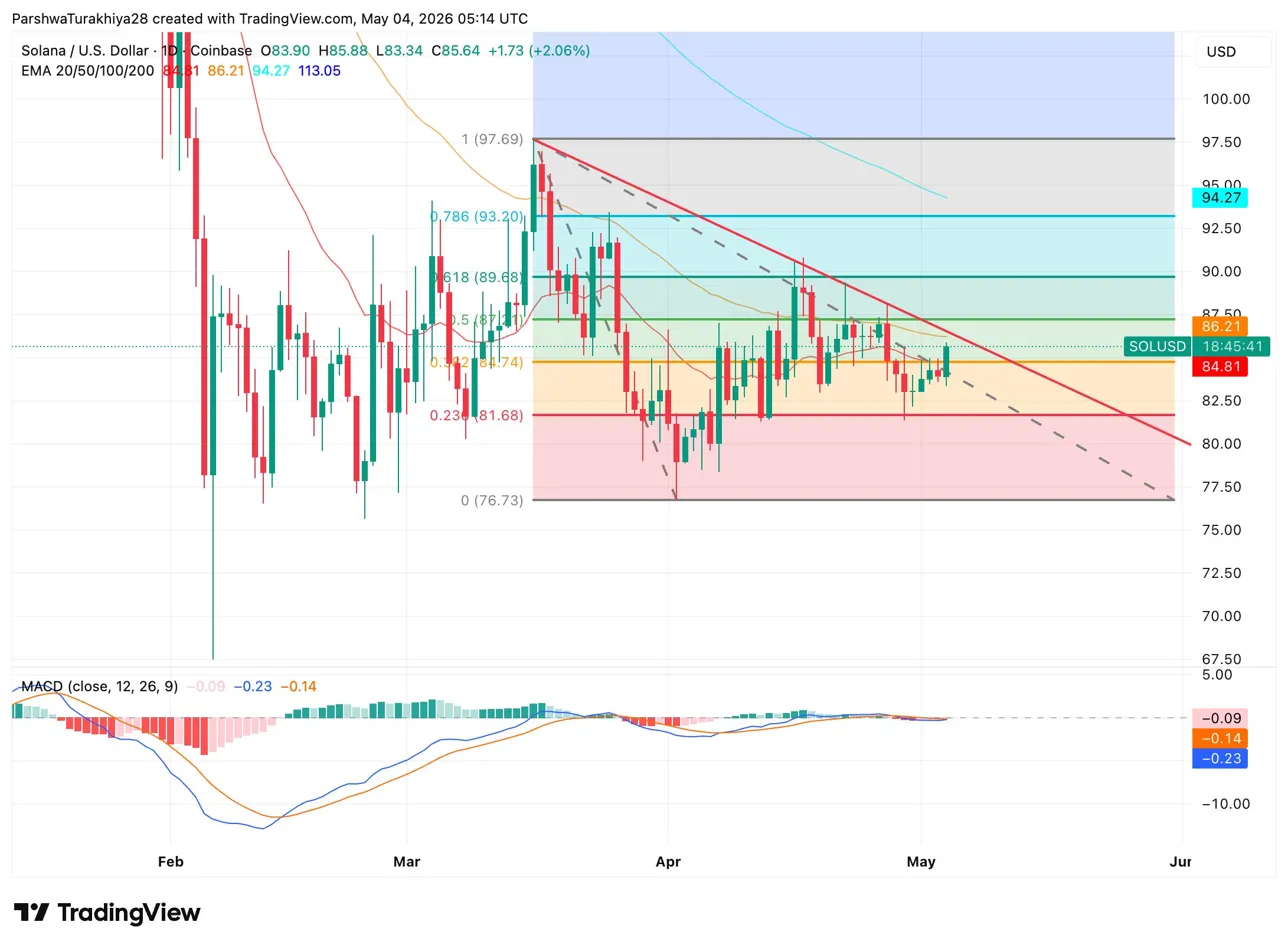
The Fibonacci retracement runs from the cycle low at $76.73 to the swing high at $97.69. SOL has been working through those levels since the March peak and is currently sitting between the 0.382 at $84.74 and the 0.5 at $87.21, with today’s session pushing into that range. The 50-day EMA at $86.21 sits inside the same zone, making $84.74 to $87.21 the immediate decision range.
The descending trendline from the March high runs through the $87 to $88 area, adding a third layer of resistance to the 0.5 Fib and 50-day EMA. The MACD below the chart has both lines below zero, with the signal line at negative $0.23 and the histogram printing small red bars. Momentum has not turned bullish on the daily yet, which means the Fibonacci levels are being tested without a confirmed directional signal behind the move.
A daily close above the descending trendline and the 0.5 Fib at $87.21 would be the first clean technical breakout signal, opening the 0.618 at $89.68 and then the 0.786 at $93.20 in line with Polymarket’s $90 consensus.
Key levels for May 5
- Fib base support: $76.73
- 0.236 Fib: $81.68
- 0.382 Fib: $84.74
- Current price: $85.64
- 50-day EMA: $86.21
- Descending trendline: $87.00 to $88.00
- 0.5 Fib: $87.21
- 0.618 Fib: $89.68
- 0.786 Fib: $93.20
- 100-day EMA: $94.27
Polymarket Prices $90 At 70% For May
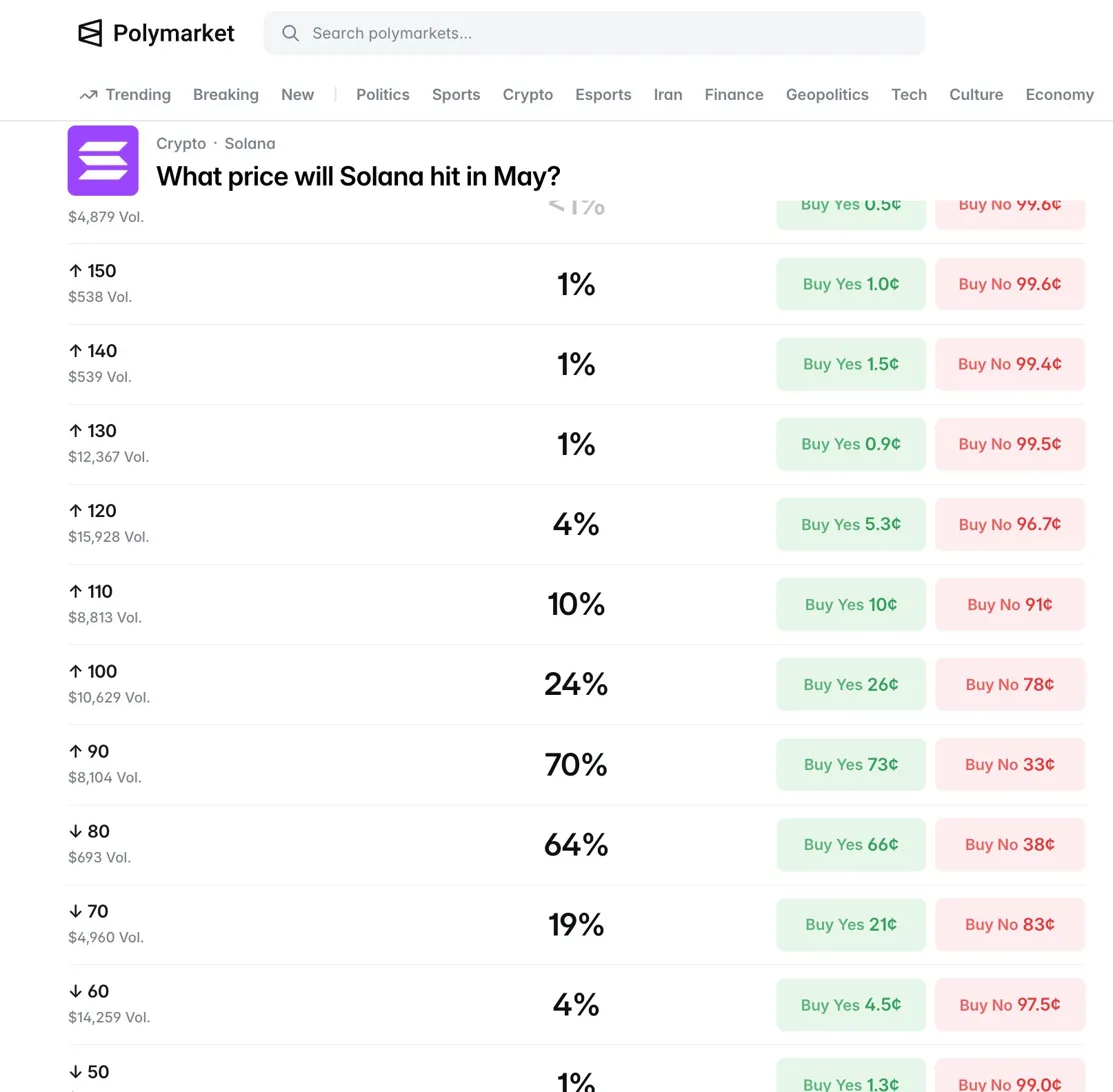
SOL Polymarket Data (Source: Polymarket)
The monthly Polymarket market on SOL’s May price shows $90 at 70% probability, the single most consensus outcome by a wide margin. $100 sits at 24% and $110 at 10%, with the upside scenarios carrying real volume at $10,629 and $8,813 respectively. On the downside, $80 gets 64% and $70 gets 19%.
The 70% on $90 is notable because it sits exactly at the 0.618 Fibonacci level at $89.68. Polymarket traders are effectively pricing the Fibonacci target as the month’s most likely outcome without necessarily knowing they are doing so. The $80 downside at 64% reflects the same crowd hedging against a return to the 0.236 Fib at $81.68, which has been the floor through April.
$381M Flowed Into Solana In Three Months, Mostly From Ethereum
Artemis data shows Solana attracted $381.1M in ecosystem inflows over the past three months. Ethereum contributed $263.6M, nearly 69% of the total. The next largest sources were a cross-chain protocol at $37.2M, Coinbase’s Base at $35.3M, and another protocol at $32.5M. The concentration from Ethereum is the most meaningful data point. Capital rotating out of Ethereum and into Solana is not just a narrative, it is showing up in on-chain flow data at scale.
Visa’s $7B stablecoin settlement network and Meta’s USDC creator payments both running on Solana provide the institutional demand side. The Artemis flow data shows the on-chain demand side moving in the same direction.
SOL Derivatives: Volume Jumps, OI Builds, Shorts Getting Squeezed
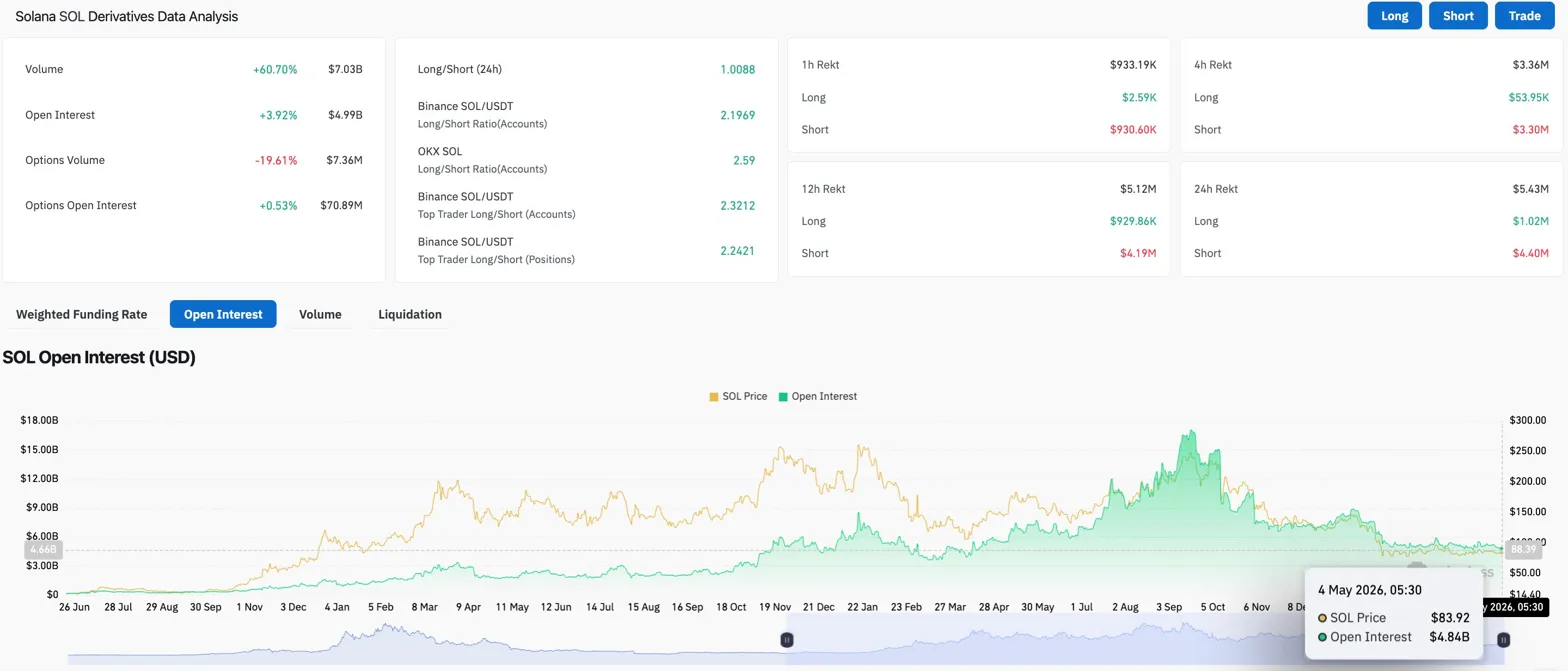
Futures volume jumped 60.70% to $7.03B while OI rose 3.92% to $4.99B. Volume and OI both moving up together points to fresh positioning entering the market rather than churn. Options volume fell 19.61% to $7.36M but options OI rose 0.53% to $70.89M, existing directional hedges staying open.
The long/short ratio sits at 1.0088, flat. Binance and OKX top traders lean long above 2.19. Over 24 hours, shorts absorbed $4.40M in liquidations against $1.02M for longs, sellers taking more than four times the pain. That squeeze dynamic with rising OI and volume confirms fresh buyers are entering as shorts get washed out near the Fibonacci resistance zone. Current OI at $4.84B sits well below the late 2025 peak near $16B.
SOL Price Prediction: May 5 Outlook
- Upside: SOL closes above the descending trendline and the 0.5 Fib at $87.21 on a daily basis, opening the 0.618 at $89.68 and Polymarket’s $90 consensus as the next target. Fresh positioning confirmed by rising volume and OI, combined with $381M in ecosystem inflows backing the demand story, support the move. The 0.786 at $93.20 and 100-day EMA at $94.27 become the mid-May targets if $90 breaks.
- Downside: The descending trendline holds and SOL fades back below the 0.382 Fib at $84.74. The MACD remaining below zero without a bullish cross means the momentum is not confirmed yet, and a rejection at the trendline without a daily close above it would put the 0.236 Fib at $81.68 back in view. Polymarket’s 64% on $80 as the downside scenario reflects how real that risk remains.
Disclaimer: The information presented in this article is for informational and educational purposes only. The article does not constitute financial advice or advice of any kind. Coin Edition is not responsible for any losses incurred as a result of the utilization of content, products, or services mentioned. Readers are advised to exercise caution before taking any action related to the company.


