


- Tokenized stock transfer volume on Solana surpassed $10B for the first time ever
- SOL spot ETFs saw a $3.94M outflow on June 25 despite the volume milestone
- Spot exchange netflow turned positive, signaling accumulation near current lows
Solana just became the go-to chain for tokenized equities, with transfer volume crossing $10B for the first time, even as SOL itself struggles to hold $68.
Is Solana’s On-Chain Growth Disconnected From Price?
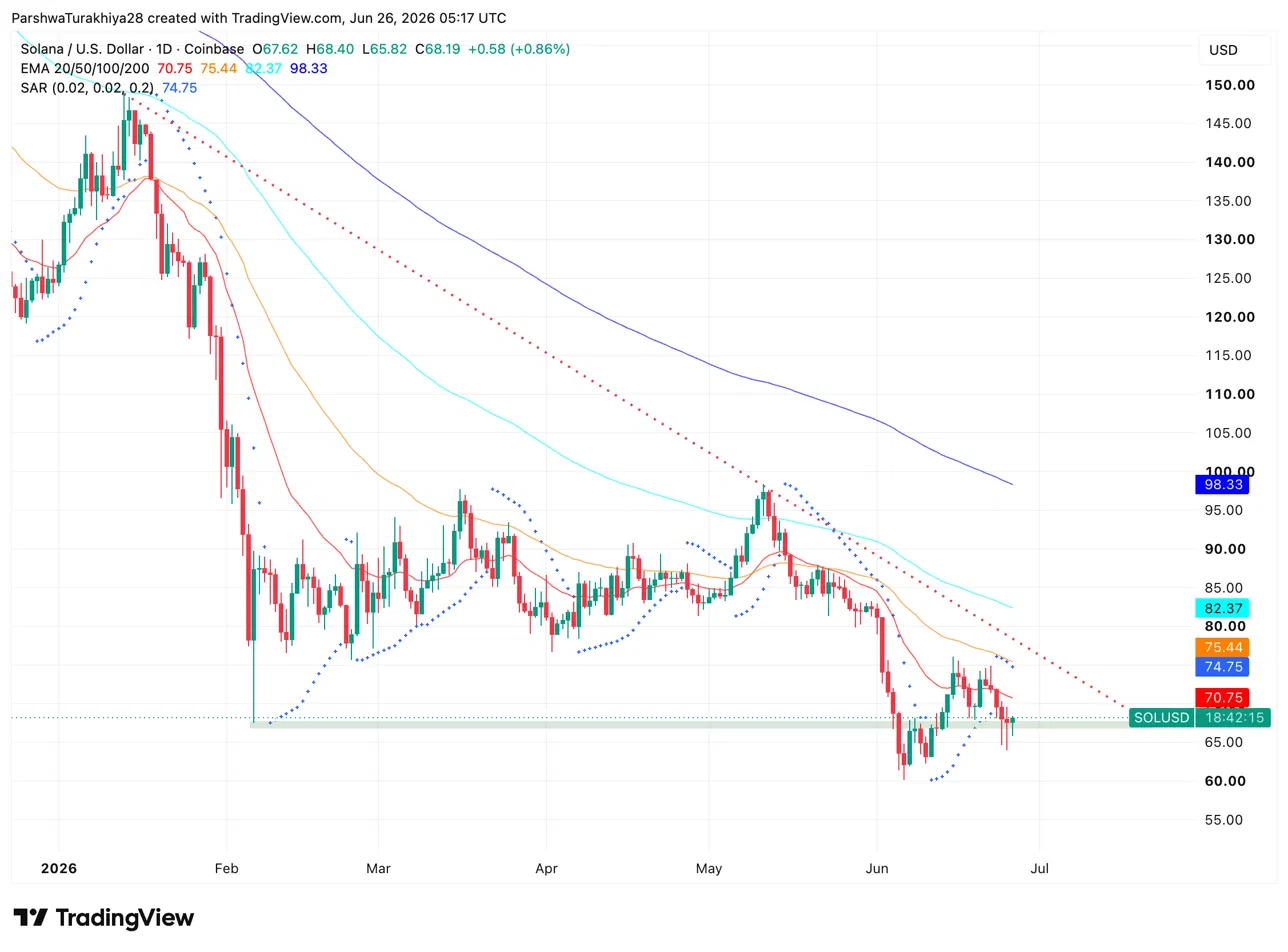
The daily chart shows SOL stuck well below every major moving average, with the 20-day EMA at $70.75, the 50-day at $75.44, the 100-day at $82.37 and the 200-day at $98.33. That stacking confirms a downtrend that’s been in place since the January peak near $145. Price carved a horizontal support zone between $59 and $61 in early June, bounced toward $70, then slipped back to test that zone again this week.
The Parabolic SAR at $74.75 remains above spot, keeping sellers in technical control. Key levels: support at $65.82 and the $59-$61 zone, resistance at $70.75 and then a heavier wall at $75.44 on the 50-day EMA.
What Do Solana’s Derivatives Show About Trader Positioning?
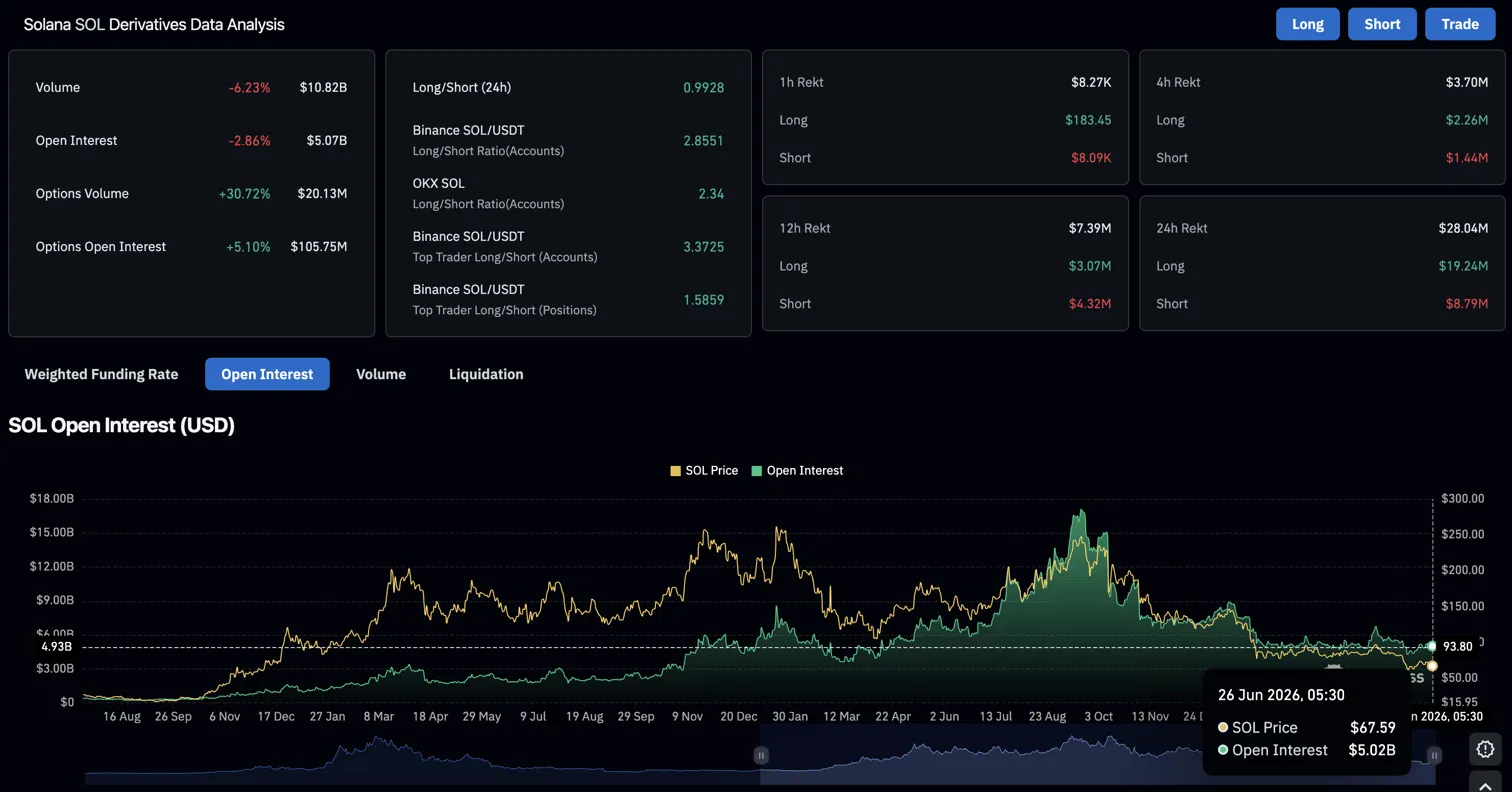
Derivatives volume fell 6.23% to $10.82B while open interest dropped 2.86% to $5.07B, both declining together, a sign traders are stepping back rather than rotating positions. Liquidations over 24 hours hit $28.04M, split $19.24M longs against $8.79M shorts, showing bulls who bought the recent bounce got caught on the latest leg down.
The more recent picture looks calmer. Over the past hour, longs lost $183.45K against just $8.09K for shorts, a much smaller and more balanced split that suggests the heaviest forced selling has already passed through the market.
Why Are SOL Holders Accumulating Despite The Price Slide
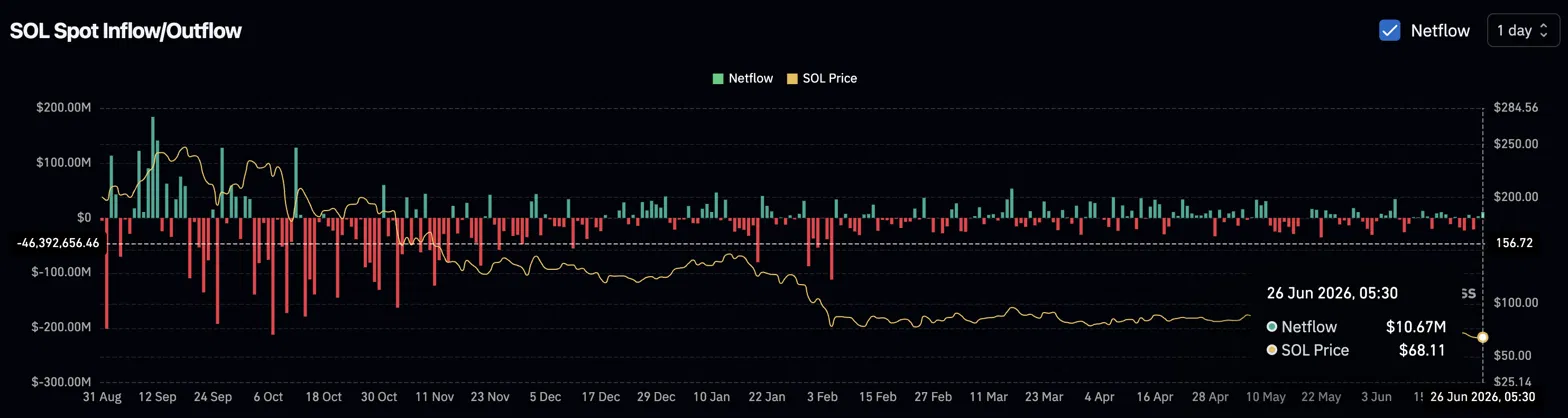
Spot exchange netflow data shows a shift. After months of heavy outflows through late 2025 and into early 2026, recent days show small but steady positive netflow, including $10.67M moving off exchanges on June 26. Coins leaving exchanges usually means holders are moving into self-custody rather than lining up to sell.
SOL spot ETFs paint a quieter picture. Bitwise’s BSOL saw a $3.94M daily outflow on June 25, pulling cumulative net inflow down to $1.13B across all eight funds, with total net assets at $755.51M. Most smaller funds, including Fidelity’s FSOL and Grayscale’s GSOL, saw zero net flow that day. Institutional demand has gone quiet, not reversed.
Meanwhile, tokenized equities on Solana hit a record daily volume of $553M, and cumulative transfer volume for tokenized stocks on the network broke $10B for the first time, according to Solana-focused trackers. Industry-wide, monthly tokenized stock volume hit $5.3B last month, up 44% month over month, with Solana capturing the largest share of that growth.
Solana Price Prediction: Upside and Downside Targets
- Upside case: Accumulation continues, ETF flows stabilize, and SOL reclaims $70.75 on its way to $75.44.
- Downside case: The $59-$61 support zone breaks under renewed selling, sending SOL toward $55 for the first time since early 2026.
Disclaimer: The information presented in this article is for informational and educational purposes only. The article does not constitute financial advice or advice of any kind. Coin Edition is not responsible for any losses incurred as a result of the utilization of content, products, or services mentioned. Readers are advised to exercise caution before taking any action related to the company.


