 Price Prediction March 2, 2025: Can It Reclaim $150?")
- Solana holds key support at $140, with resistance at $150 and potential targets at $155-$160.
- RSI nears the oversold zone, suggesting a possible bounce if buying interest increases.
- Derivatives trading volume surged 11.02%, signaling strong market engagement in SOL.
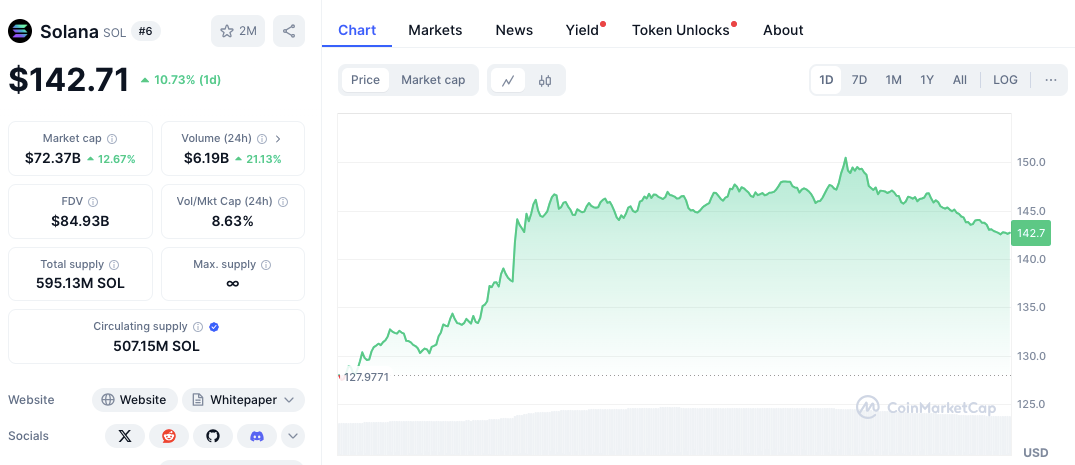
Solana (SOL) has seen a strong rally, reaching $142.65 after an 11.58% increase in the last 24 hours. The price surged from $127.97 to above $150 before pulling back slightly.
This movement suggests a mix of strong bullish momentum and some profit-taking at higher levels. As traders monitor key technical levels, Solana’s outlook remains fluid, with potential for further gains or corrective dips.
Solana’s Market Trend and Key Support
Solana has been trending upward, reflecting growing investor interest. The price action suggests that SOL has found key support levels, bolstering the possibility of stability or further upward movement.
The primary support sits at $140, a level where the price recently bounced. If the price drops further, $135 serves as another critical support, as it marked a base before the major rally. In addition, $128 remains a significant support zone, providing a foundation in case of a deeper correction.
Resistance Levels and Potential for Gains
On the upside, SOL faces resistance at $150, a level where the price peaked before retreating. A break above this could open the path toward $155 and $160, where stronger resistance may appear.
However, minor resistance at $145 has already caused brief dips, which traders should watch closely. If the buying pressure continues, these higher resistance levels could be tested soon.
Technical Indicators: Mixed Signals
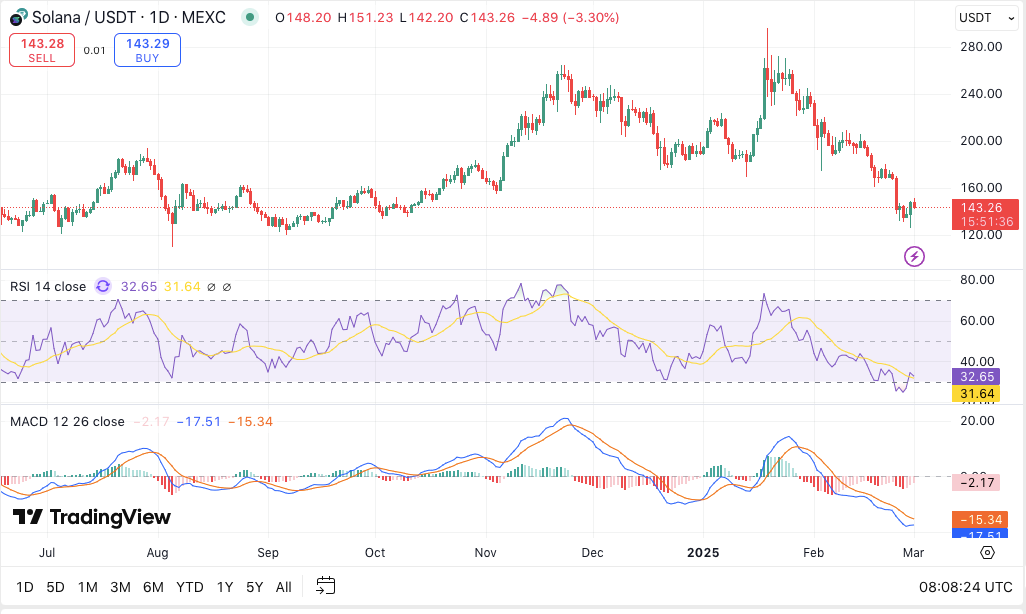
The Relative Strength Index (RSI) currently stands at 32.47, nearing the oversold zone. This suggests that the recent selling pressure may be overdone, potentially leading to a bounce if buyers regain control.
Meanwhile, the Moving Average Convergence Divergence (MACD) indicator shows the MACD line at -17.55, below the signal line at -15.35, confirming a bearish trend. However, the histogram is flattening, suggesting that downward momentum is fading.
Derivatives Market: Increased Activity
The derivatives market for Solana has seen notable activity. According to Coinglass data, trading volume increased by 11.02% to $14.83 billion, showing growing market participation. Open interest rose 10.35% to $4.50 billion, suggesting higher trader engagement.
Also, options trading volume surged 45.91% to $5.11 million, indicating increased speculative interest. However, options open interest declined by 39.89% to $5.72 million, which means that traders are closing existing positions.
Disclaimer: The information presented in this article is for informational and educational purposes only. The article does not constitute financial advice or advice of any kind. Coin Edition is not responsible for any losses incurred as a result of the utilization of content, products, or services mentioned. Readers are advised to exercise caution before taking any action related to the company.


