 Skyrockets to a 25-Month High; Is a Correction Looming?")
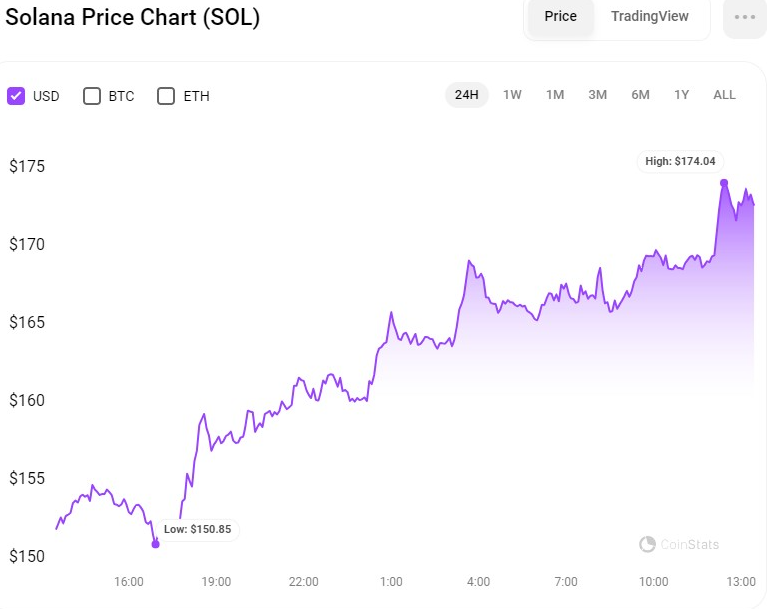
- Solana soars to $173.27, marking a 14% rise in 24 hours, hitting a 25-month high.
- SOL sees a 51% increase in 30 days, with predictions pointing towards $250.
- RSI hits 80.50, signaling potential overbuying amid its bullish surge.
Solana (SOL) price has surged by 14% in the last 24 hours, reaching $173.27 as bullish momentum continues to build in the cryptocurrency market. This impressive gain is part of a broader uptrend for SOL, which has seen its value increase significantly over the past month.
The cryptocurrency industry, buoyed by Bitcoin’s new all-time high, has been experiencing a substantial uptrend in valuation, with SOL showcasing robust bullish sentiment.
Bullish Sentiments in Solana’s Rally
The recent price surge places Solana at the forefront of a bullish wave sweeping across the crypto sector. Over the past seven days, the SOL token has registered approximately a 23% increase, while its 30-day performance shows an even more remarkable 51% uptick.
This sustained buying pressure is a clear indicator of the growing investor confidence in Solana’s potential. Concurrently, this bullish momentum has been buoyed by the announcement of an Israeli Shekel-backed stablecoin, BILS, which will launch using token extensions on Solana.
This uptrend has resulted in Solana recording a new 25-month high, signaling strong bullish sentiment within the market. Analysts and traders have expressed bullish predictions for SOL, with some forecasting a potential rally toward the $250 mark. This sentiment is based on the transformation of the March 2022 resistance level of around $140 into a strong support zone.
Furthermore, the SOL/ETH chart analysis indicates a promising scenario for Solana against Ethereum, with the potential for substantial outperformance. Christopher Inks, founder of TexasWest Capital, and macro expert Raoul Pal have both identified technical patterns suggesting a breakout and bullish momentum for SOL in comparison to ETH. These analyses contribute to the growing optimism surrounding Solana’s market position and potential for further appreciation.
SOL/USD Technical Analysis
On the SOLUSD 4-hour price chart, the Keltner Channel bands are rising, with the upper, middle, and lower bands at $167.90, $156.57, and $145.22, respectively. This suggests a strong upward trend in price movement, with probable resistance at the upper band and support in the middle band.
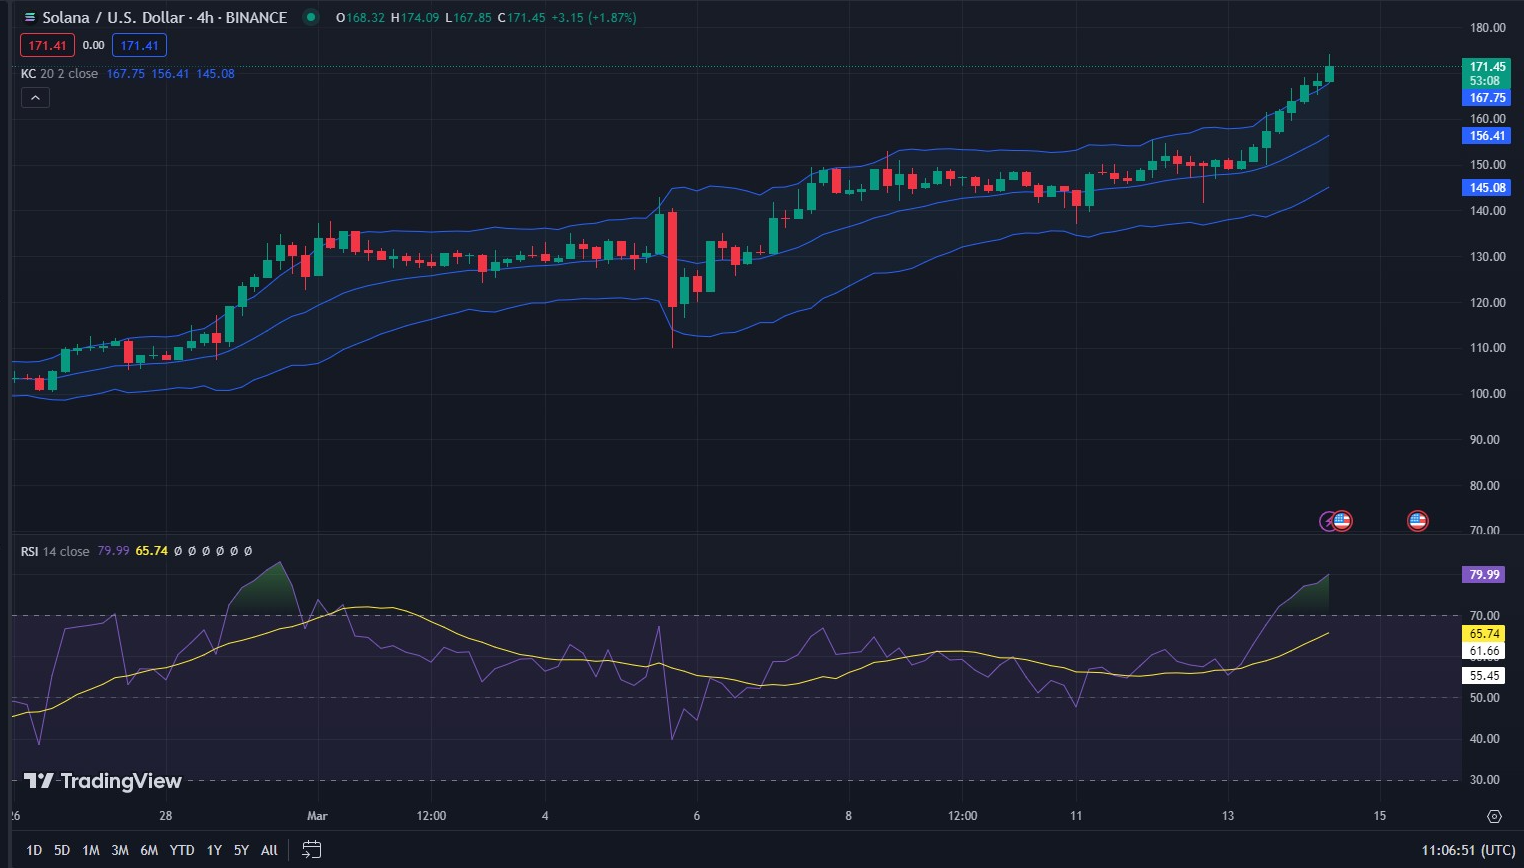
SOL/USD 4-hour price chart (source: TradingView)
However, following a sequence of green candlesticks, the price action has breached the upper band, indicating that the bullish trend may continue. However, because it is above the upper band, there is a chance of a retreat or consolidation before a further upward trend. This shift may provide a purchasing opportunity for traders trying to enter the market at a cheaper price point.
Furthermore, the Relative Strength Index (RSI) reading of 80.50 indicates that SOLUSD may be overbought in the immediate term, implying a market reversal or correction. As a result, traders should exercise caution and implement tight stop-loss orders to safeguard profits in the event of a reversal.
Disclaimer: The information presented in this article is for informational and educational purposes only. The article does not constitute financial advice or advice of any kind. Coin Edition is not responsible for any losses incurred as a result of the utilization of content, products, or services mentioned. Readers are advised to exercise caution before taking any action related to the company.


