


- Solana has been on a bearish trend for the past 24 hours.
- Technical indicators show the decline is set to continue.
- The bearish momentum has also taken over the 4-hour price chart.
According to Solana price analysis, the price of SOL/USD has been falling, and the cryptocurrency has been on a slight downward trend. SOL/USD fell from a high of $12.40 to a low of $11.30 over the previous week. But after a few days, the bulls began to show some signals, driving the price up to $11.48. SOL/USD is now trending downward, therefore traders should keep an eye out for a breach of the $11.20 support level.
Significant market volatility is evidenced by the fact that Solana’s 24-hour trading volume increased by 16.22% to $131,802,314 and its market capitalization fell by 0.75% to $131,802,314.
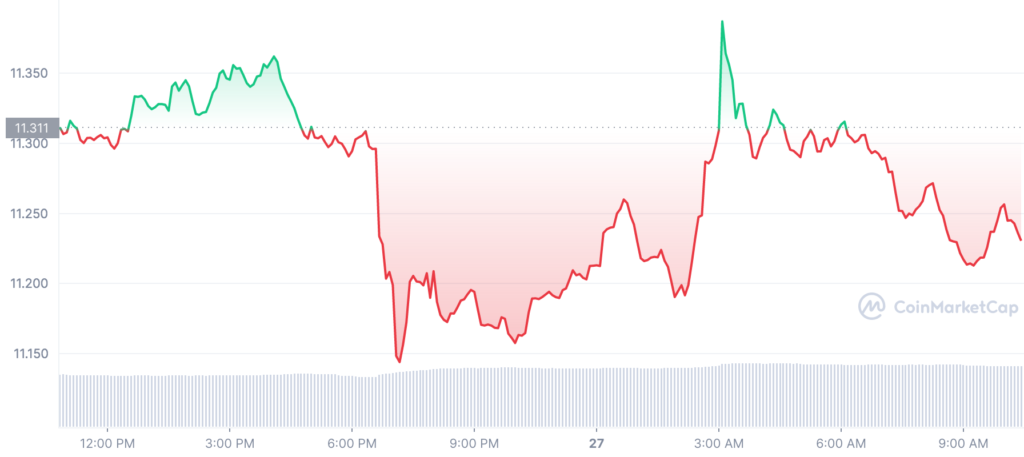
The coin’s value has been steadily declining for the past 24 hours, according to the price analysis. The bearish momentum has caused the price level to drop to $11.22. Prior to now, SOL’s price climbed to a new resistance level of $12.02.
Due to the bear’s dominance in the SOL market, the price then unexpectedly dropped. Due to the present bearish momentum, they were able to lower SOL’s price below two support levels of $11.9 and $11.46.
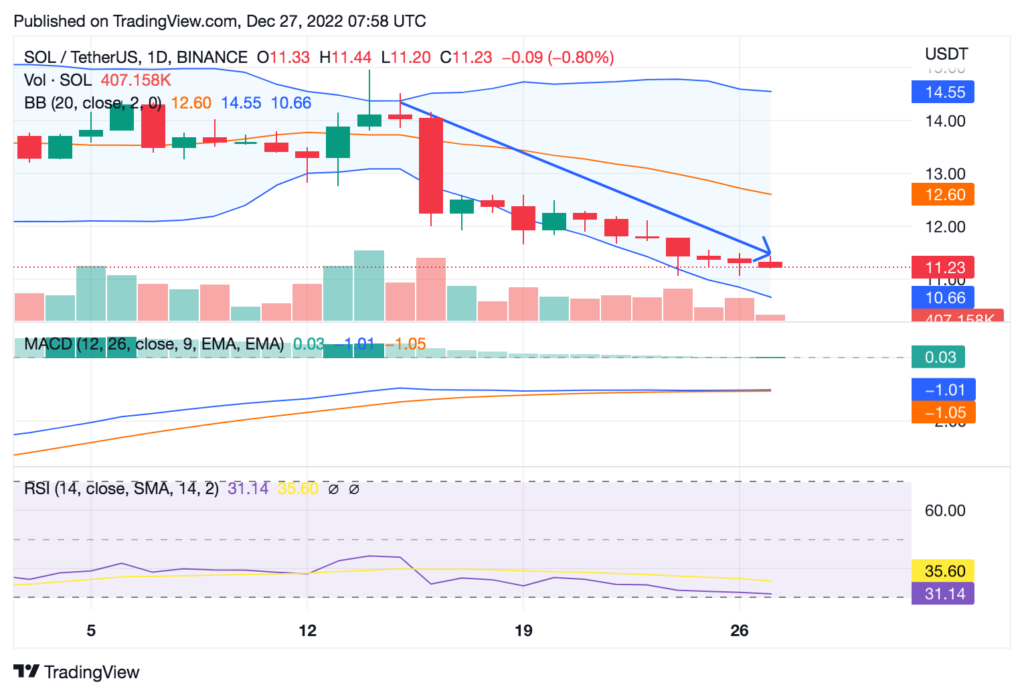
The Moving Average Convergence/Divergence (MACD) indicator has shifted to the downside, indicating additional downward pressure. Displaying bearish momentum, the Relative Strength Index (RSI) has also fallen into the bearish zone. A bearish market is indicated by the downward trending 50-day and 200-day moving average lines.
The RSI reading of 31.14 indicates that the SOL market is experiencing selling pressure and that the current bullish trend may be coming to an end. Bulls may still have a chance because the RSI is still above its SMA, but this does not ensure a price decline and instead advises investors to keep an eye on the market.
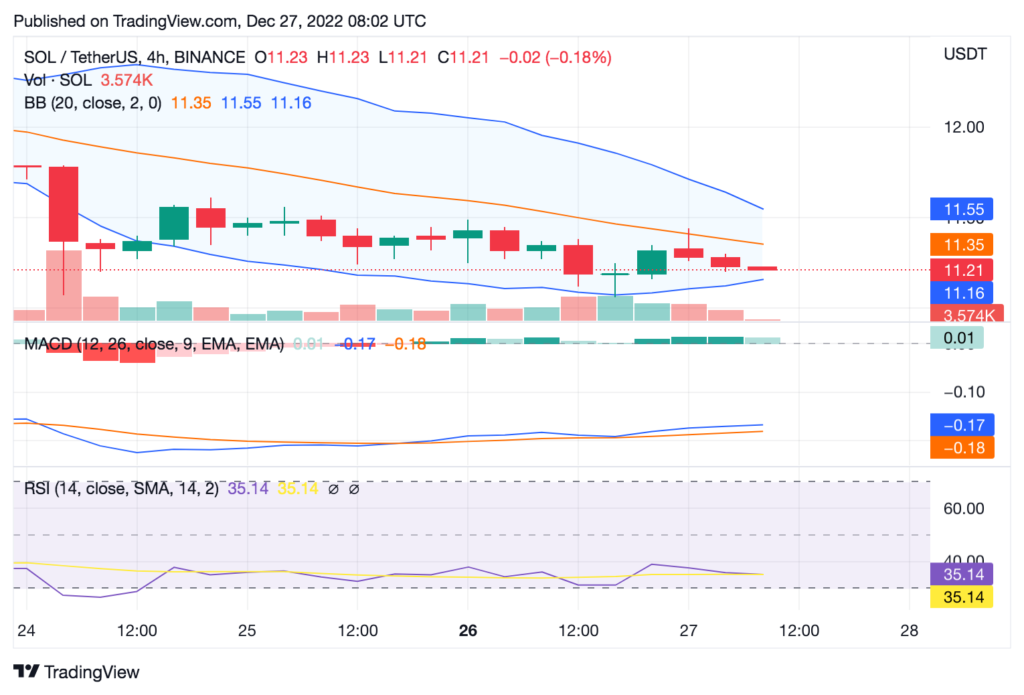
The SOL indicator’s positive value represents a rise in bearish momentum, while its negative value represents a decline in momentum. The 4-hour price chart indicates that bears may continue to control the SOL market since early December. This shows that bear power is growing and suggests that prices may continue to decline.
Disclaimer: The views and opinions, as well as all the information shared in this price analysis, are published in good faith. Readers must do their own research and due diligence. Any action taken by the reader is strictly at their own risk, Coin Edition and its affiliates will not be held liable for any direct or indirect damage or loss.
Disclaimer: The information presented in this article is for informational and educational purposes only. The article does not constitute financial advice or advice of any kind. Coin Edition is not responsible for any losses incurred as a result of the utilization of content, products, or services mentioned. Readers are advised to exercise caution before taking any action related to the company.
 Price Prediction 2026, 2027, 2028, 2029, 2030-2050")


