 Price Prediction 2024-2030: Will ID Price Hit $5 Soon?")
- By 2025, the ID token could peak at $3.50 due to BTC’s halving cycle effects.
- The 2028 BTC halving might drive ID to $5.17, though bear markets could drop it to $2.86.
- 2030 SPACE ID could fluctuate between $2.00 and $5.62 as market interest varies.
The demand for Web3 services has been on a rapid rise, and in response, SPACE ID emerged as a universal name service network for decentralized identity and Web3 name services. Launched on March 22, 2023, the SPACE ID token saw an initial surge to $0.9305 within weeks, capturing widespread attention.
However, the excitement was short-lived as the token dropped to an all-time low of $0.1713 by October. But just when it seemed the cryptocurrency’s future was uncertain, SPACE ID made a stunning comeback, reaching a new high of $1.83 by March 17, 2024.
With the token now hovering around the $0.40 support level, market indicators show a neutral sentiment, suggesting a balancing act between optimism and caution. Could this calm indicate an imminent price breakout? In this Coin Edition’s price prediction article, let’s learn more about SPACE ID’s future trajectory.
Table of contents
- What is SPACE ID (ID)?
- SPACE ID (ID) Current Market Status
- SPACE ID (ID) Price Analysis 2024
- SPACE ID (ID) Price Prediction 2024
- SPACE ID (ID) Price Prediction 2025
- SPACE ID (ID) Price Prediction 2026
- SPACE ID (ID) Price Prediction 2027
- SPACE ID (ID) Price Prediction 2028
- SPACE ID (ID) Price Prediction 2029
- SPACE ID (ID) Price Prediction 2030
- SPACE ID (ID) Price Prediction 2040
- FAQs
What is SPACE ID (ID)?
SPACE ID (ID) is a revolutionary cryptocurrency platform designed for the Web3 world. It simplifies the process of discovering, registering, trading, and managing Web3 domain names, allowing users to control their digital identity in a decentralized manner. Built on the secure Ethereum network, SPACE ID ensures transparency, immutability, and seamless transactions.
The platform’s core feature is its user-friendly interface, which allows users to easily search for available domain names, register them, and trade them on marketplaces like OpenSea. Whether you’re looking to buy or sell, SPACE ID makes it simple to capitalize on the growing demand for Web3 domains.
What sets SPACE ID apart is its efficiency and security. Unlike other platforms, it offers an all-in-one solution for Web3 domain management. Its simplicity and the security of blockchain technology make it a standout choice for both seasoned developers and newcomers to the crypto space.
Looking forward, SPACE ID holds significant potential. It’s not just about domain trading—it could serve as a key tool for authentication and digital identity in the Web3 space.
SPACE ID (ID) Current Market Status
Despite navigating a bearish momentum for much of the past month, the ID token experienced a significant surge in value, especially toward the end of the period. Consequently, the token pushed its price above the monthly opening of $0.4056, peaking at $0.4515, representing an impressive 5.48% increase.
This upward trend has persisted on the weekly chart, reflecting steady growth with minimal pullbacks, signaling solid bullish momentum in the short term. As of press time, ID was trading at $0.4316, positioning it among today’s top gainers with a notable 16% uptick.
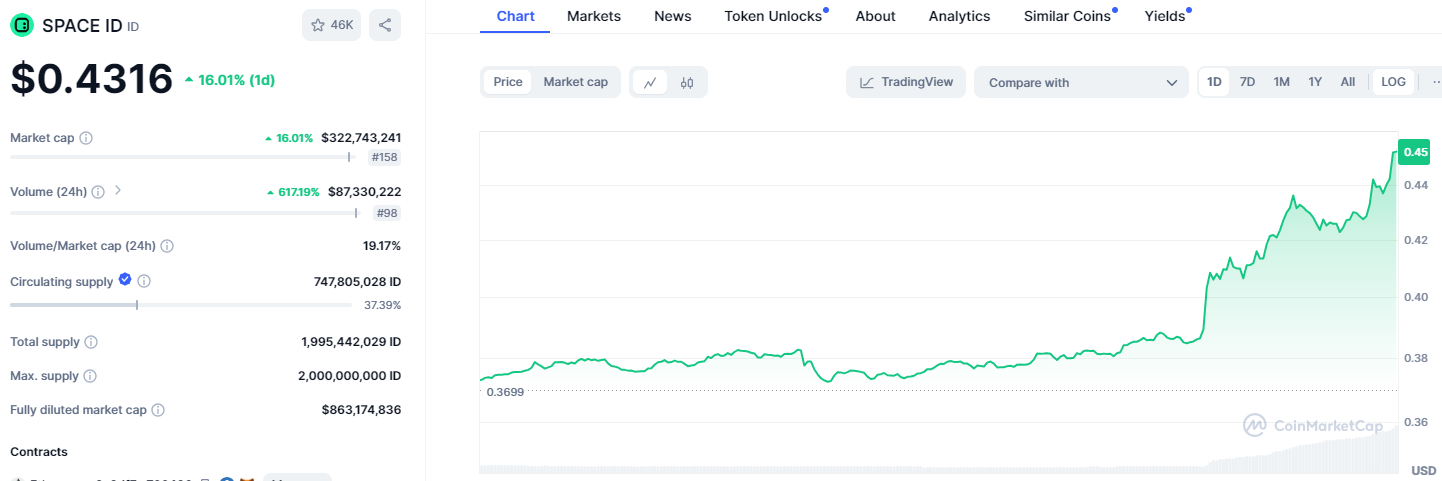
This price spike accompanied a sharp increase in the token’s market cap, now at $322,743,241, placing ID at 158th in the global cryptocurrency rankings. Even more intriguing is the surge in trading volume, which rocketed over 617% within the last 24 hours to $87,330,222. This substantial increase in volume highlights growing investor confidence and heightened trading activity around the token.
SPACE ID (ID) Price Analysis 2024
Following this bullish sentiment, investors are increasingly optimistic about ID’s potential. With a circulating supply of 747,805,028 ID tokens, representing only 37.39% of its maximum supply, there is significant room for future growth.
Coin Edition explores ID’s future price trajectory through real-time data and technical indicators as anticipation builds. Could this be the beginning of an even bigger move? Let’s find out.
SPACE ID (ID) Price Analysis – Bollinger Bands
The weekly Bollinger Bands are slowly converging toward each other, indicating waning price volatility in the ID market. This suggests a potential consolidation phase, during which the price may trade within a narrower range before breaking out in a new direction.
Further cementing this sentiment is the upward movement of ID’s price toward the middle band at $0.4642. This level is critical, as a breach above it could push ID to the upper band around the $0.7395 level.
Conversely, failure to break through it could result in a pullback toward the lower band at $0.1890.
SPACE ID (ID) Price Analysis – Relative Strength Index
Just like the Bollinger Bands, the RSI index is showing a potential price consolidation on the horizon. Data from CoinMarketCap show that the RSI recently crossed over with the signal line, indicating a bullish divergence in the short term.
However, with the RSI currently trending at 46.36, close to the neutral 50 level, it implies the token is entering a consolidation period before resuming its upward movement. Yet, if the bullish sentiment strengthens, ID could witness its price challenge the $0.5614 barrier. Conversely, the crypto might retrace the $0.3000 support.
SPACE ID (ID) Price Analysis – Moving Average Convergence Divergence
On the other hand, the MACD indicator tells a bullish sentiment is building as the MACD line is on the verge of a crossover with the signal line. Moreover, the MACD histogram’s chart portrays a similar image, with its red bars decreasing in size toward the zero line.
Such a scenario indicates waning bearish sentiment in the ID token and a possible shift in momentum to the upside. Should this move come into play, the cryptocurrency might see its value surge to the $0.5614 resistance level, with the potential to surpass it. Contrastingly, it could retrace to the $0.3000 mark to find support.
SPACE ID (ID) Price Prediction 2024
The DMI index presents a close battle between the bulls and the bears, as indicated by the readings of the +DI at 23.9805 and the -DI at 23.3830. The slight edge favoring the +DI suggests that the bullish momentum is marginally more potent, though not by a significant margin. This balance hints at a market that neither strongly favors buyers nor sellers, keeping the overall direction unclear.
However, the ADX, standing at 16.5766, reflects a weak market trend. An ADX below 20 typically indicates a lack of strong directional movement, confirming that while there may be a slight bullish advantage, the overall strength behind the current market trend is weak. Therefore, despite the slight positive shift, the market remains relatively indecisive, with no dominant force driving it in either direction.
Given the current market conditions, the ID token will likely oscillate within a rangebound pattern. On the lower side, it could retest its all-time low of $0.1713, especially if bearish forces gain momentum. However, should the bulls regain control, ID may also challenge its all-time high of $1.836, possibly breaking through the psychological $2 mark by the end of the year.
SPACE ID (ID) Price Prediction 2025
Per Coin Edition’s projections, SPACE ID could reach $3.50 in 2025 due to BTC halving effects. Conversely, the token may dip to $1.479 amid post-halving market corrections and reduced investor enthusiasm.
SPACE ID (ID) Price Prediction 2026
Our price forecast shows the ID token may experience market corrections in 2026 following the 2024 BTC hype, which could result in a price drop to $0.805. Yet, the cryptocurrency may climb to $2.52, driven by steady Web3 adoption.
SPACE ID (ID) Price Prediction 2027
Coin Edition predicts ID could peak at $3.95 in 2027, fueled by a market rebound ahead of the 2028 BTC halving. However, due to ongoing price fluctuations and market instability, it may hit a low of $1.83.
SPACE ID (ID) Price Prediction 2028
With the anticipation of BTC’s 2028 halving, ID might surge to $5.17, per Coin Edition’s outlook. Nonetheless, bear markets could lower its price to $2.86 as market corrections persist.
SPACE ID (ID) Price Prediction 2029
Coin Edition forecasts ID could reach a peak of $6.20, supported by strong community engagement and decentralized identity demand. On the downside, it may drop to $3.95 if global market conditions weaken investor confidence.
SPACE ID (ID) Price Prediction 2030
In 2030, SPACE ID could see its value correct toward the psychological $2.00 mark to find support as its market interest fades. Nevertheless, Coin Edition anticipates a potential recovery to the $5.62 zone, driven by widespread Web3 domain adoption.
SPACE ID (ID) Price Prediction 2040
By 2040, Coin Edition expects ID to peak at $15.00, benefiting from long-term blockchain integration. On the contrary, regulatory challenges and market evolution may push it as low as $6.20.
FAQs
SPACE ID is a Web3 platform for managing decentralized identities and domain names, offering an all-in-one solution for discovering, registering, and trading Web3 domains on Ethereum.
You can purchase SPACE ID (ID) on cryptocurrency exchanges like Binance by trading other cryptocurrencies like Bitcoin (BTC) or Ethereum (ETH) for ID.
SPACE ID shows strong potential with bullish market trends, making it a promising investment. However, like all cryptocurrencies, it comes with risks due to market volatility.
SPACE ID (ID) ‘s all-time high is $1.83, reached on March 17, 2024.
Per our price forecast, SPACE ID could reach $5 by 2028, driven by Web3 adoption and BTC’s halving cycle.
The circulating supply of SPACE ID (ID) is 747,805,028 tokens, which represents 37.39% of its maximum supply.
Depending on market conditions, SPACE ID could surpass its all-time high of $1.83 by 2025 or beyond.
SPACE ID hit an all-time low of $0.1713 in October 2023.
The specific founder of SPACE ID (ID) is not mentioned. However, it is believed to have been formed by a group of engineers and Web3 enthusiasts who aim to create a universal name service network backed by decentralized blockchain technology.
SPACE ID was launched on March 22, 2023.
You can store your ID safely on your Bitget account or crypto wallet app, BG Wallet.
By 2024, SPACE ID could oscillate between its all-time low of $0.1713 and potentially exceed its ATH of $1.836.
Due to market corrections, SPACE ID might peak at $3.50 in 2025 and potentially low at $1.479.
After the 2024 BTC halving hype fades, SPACE ID may rise to $2.52 or drop to $0.805.
By 2027, SPACE ID could reach $3.95 amid market rebounds but might also fall to $1.83.
2028 SPACE ID may climb to $5.17 due to BTC halving or fall to $2.86 amid market corrections.
SPACE ID may reach $6.20 in 2029, driven by decentralized identity demand, or drop to $3.95 due to market instability.
As market interest fluctuates, SPACE ID could peak at $5.62 or dip toward $2.00.
By 2040, SPACE ID might peak at $15.00, driven by long-term Web3 adoption, or fall to $6.20 due to regulatory challenges.
Disclaimer: The information presented in this article is for informational and educational purposes only. The article does not constitute financial advice or advice of any kind. Coin Edition is not responsible for any losses incurred as a result of the utilization of content, products, or services mentioned. Readers are advised to exercise caution before taking any action related to the company.


