


 Records a 30-Day High: Is a Bullish Breakout Imminent?")
- STX price soars to a new high, showcasing bullish momentum.
- Market capitalization jumps as STX reaches a 30-day high.
- Bullish momentum and volatility present trading opportunities in the STX market.
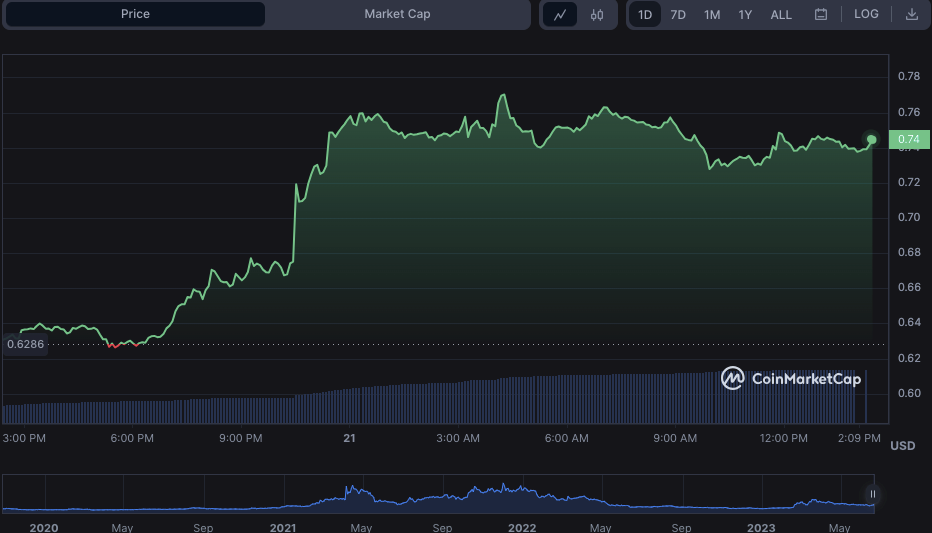
In the past 24 hours, bulls in the Stacks (STX) market achieved an incredible milestone, soaring the price to a new 30-day high. STX opened at $0.6256 and soared to an astounding $0.7724, demonstrating significant bullish momentum.
This upward trend was still in effect as of press time, with a 17.51% gain pushing the price to $0.7394.
With this spectacular price movement, STX’s market capitalization has increased significantly, jumping by 17.54% to $1,029,281,779. Furthermore, the 24-hour trading volume increased by 189.53%, hitting $348,832,353.
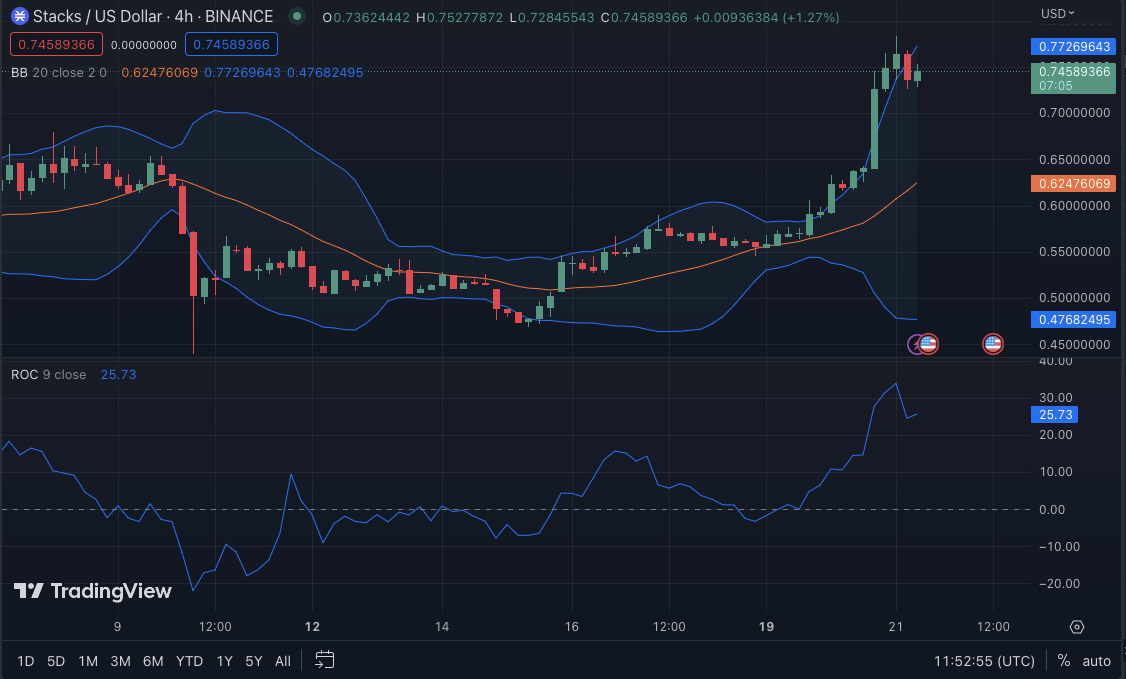
The Bollinger bands on the STX/USD 4-hour price chart show substantial volatility, with the upper band at $0.77276514 and the lower band at $0.47674266. The Bollinger bands expansion signals higher market volatility and the possibility of considerable price change.
Furthermore, the development of green candlesticks on the chart adds to the optimistic narrative. The green candlesticks reflect buyer dominance and upward price movement when the closing price is higher than the starting price.
The bullish momentum on the STX/USD 4-hour price chart is relatively strong, with the Rate of Change (ROC) rating at 25.41. The ROC calculates the percentage change in price over the last 4 hours, reflecting the rate at which the price changes.
A positive ROC of 25.41 indicates that prices rose significantly throughout this timeframe, reinforcing the optimistic mood.
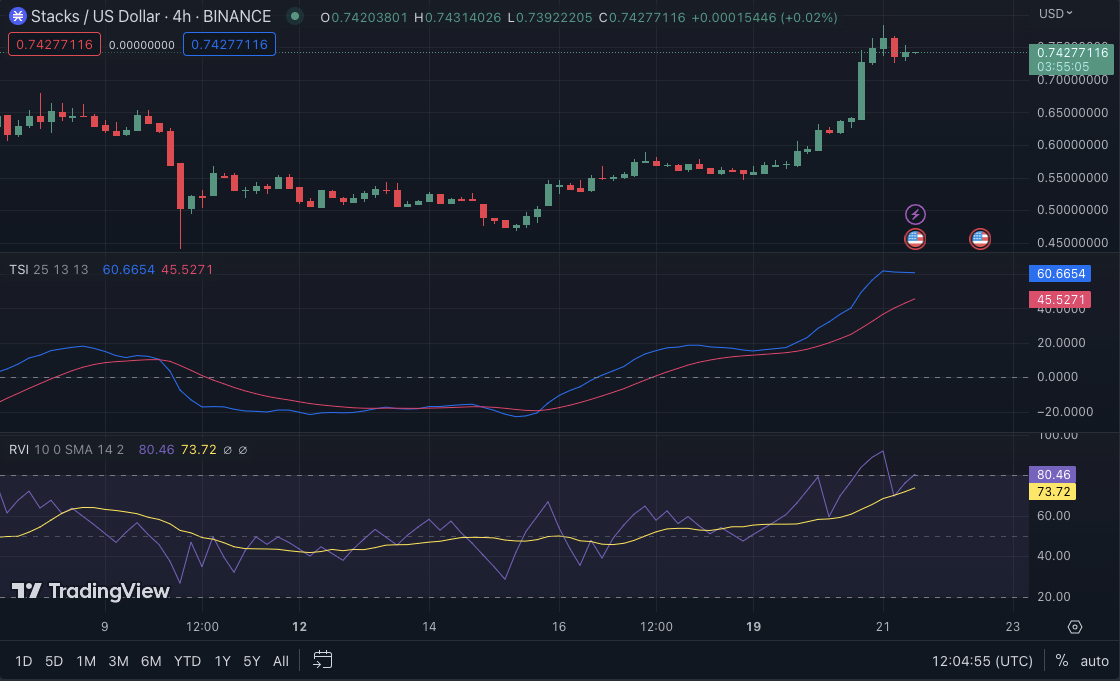
The positive momentum in the STX market is visible, with the True Strength Index pushing over its signal line with a value of 60.8717. This movement implies that buyers are in charge, and the market will likely continue rising.
The Relative Volatility Index (RVI) rating 76.09 indicates a volatile market. A rating of 50 or higher usually suggests more volatility, while a rating of 50 or below usually indicates less volatility. Consequently, a 76.09 rating indicates that the market is experiencing moderate to high volatility.
When paired with the True Strength Index (TSI) going over its signal line with a value of 60.8717, the STX market is experiencing bullish momentum and volatility. This combination suggests that the market may see significant price changes, offering trading opportunities to savvy traders.
In conclusion, the STX market is experiencing solid bullish momentum with significant price gains, increased market capitalization, and high volatility, presenting trading opportunities for savvy investors.
Disclaimer: The views, opinions, and information shared in this price prediction are published in good faith. Readers must do their research and due diligence. Any action taken by the reader is strictly at their own risk. Coin Edition and its affiliates will not be liable for direct or indirect damage or loss.
Disclaimer: The information presented in this article is for informational and educational purposes only. The article does not constitute financial advice or advice of any kind. Coin Edition is not responsible for any losses incurred as a result of the utilization of content, products, or services mentioned. Readers are advised to exercise caution before taking any action related to the company.


