 Price Prediction 2024-2030: Will STRK Price Hit $10 Soon?")
Starknet, an advanced zero-knowledge rollup (ZK rollup) for Starknet, is altering the blockchain world with its innovative approach. As a permissionless validity rollup, Starknet is designed to enable any decentralized application (dApp) to achieve unparalleled computational scale while maintaining Starknet’s renowned composability and security.
As a result, investors are increasingly turning to Starknet as a promising solution for scaling their dApps without compromising on security or decentralization. However, the question remains: how will Starknet’s STRK token perform in the rapidly developing crypto market?
Coin Edition’s latest Starknet STRK price prediction delves deep into this query, providing insights that could shape crypto investors’ and enthusiasts’ future strategies.
Starknet (STRK) Real Time Market Status
HTTP Request Failed... Error: file_get_contents(https://pro-api.coinmarketcap.com/v2/cryptocurrency/quotes/latest?slug=starknet-token): Failed to open stream: HTTP request failed! HTTP/1.1 429 Too Many Requests
What is Starknet (STRK)?
Starknet, operating as a ZK-Rollup Layer 2 network atop Starknet, scales decentralized applications without sacrificing security. By bundling transactions into an off-chain STARK proof and submitting it to Starknet as a single transaction, Starknet enhances throughput, speeds up processing, and reduces costs while retaining Starknet’s security.
In addition, Starknet utilizes ZK-Rollup technology to achieve unparalleled scalability for dApps while upholding Starknet’s rigorous security standards. The network aims to empower users to implement and use any desired social function on the blockchain, promoting inclusivity, transparency, and autonomy.
Founded in 2018 by technologists and academics, including Eli Ben-Sasson, StarkWare Industries set out to improve blockchain scalability and privacy with zk-STARKs. Although Ben-Sasson faced legal challenges over intellectual property with Technion, resulting in a settlement and his departure, StarkWare continued to push forward.
In 2020, StarkWare introduced StarkEx, a permissioned scaling solution that laid the foundation for Starknet. StarkEx quickly gained traction with platforms like dYdX and Immutable X, showcasing its potential. Building on this success, Starknet launched its genesis block in November 2021, marking a significant milestone.
A year later, in November 2022, the Starknet token (STRK) launched on the Starknet Mainnet, becoming publicly available in February 2024. Supported by substantial funding from the Starknet Foundation, Paradigm, and Sequoia Capital, Starknet has solidified its position as a key player in the blockchain space. This strategic planning has enabled Starknet to offer lower transaction fees and improved network stability as it evolves.
Starknet (STRK) Current Market Status
The STRK token is currently valued at $0.6365, reflecting a 7.23% rise in the past 24 hours and an 8% increase over the week. With 1,460,140,491 STRK in circulation, its market cap has climbed to $929,412,490, securing its place as the 75th largest cryptocurrency. The 24-hour trading volume for STRK also saw a significant jump, surging by 68.03% to reach $105,449,481.
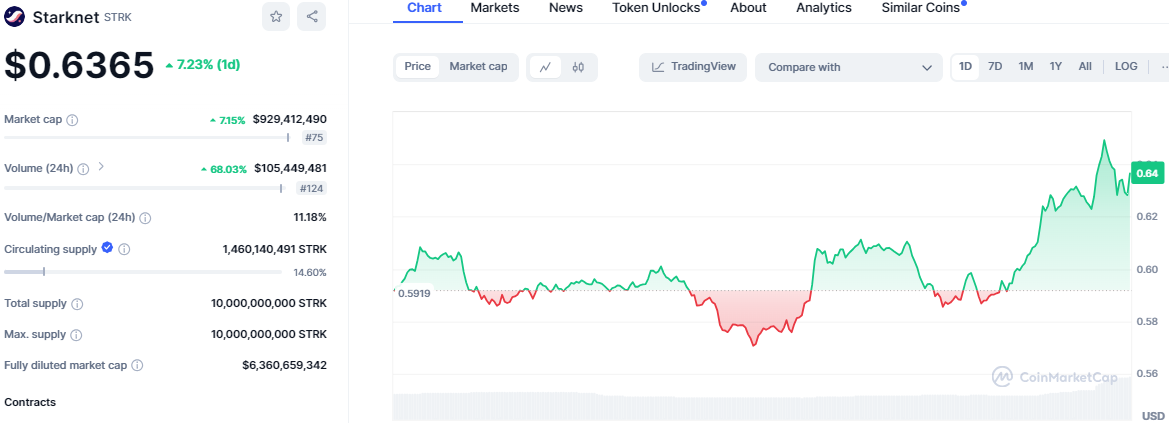
Despite these impressive gains, STRK has yet to shake off the bearish momentum that has plagued it over the past month. However, market analysts are optimistic, suggesting that if STRK can surpass the $0.7274 mark, it might signal the end of its bearish trend.
Starknet (STRK) Price Analysis 2024
STRK’s recent price movements have captivated traders. Despite a month-long bearish trend, the token shows signs of a comeback, bouncing back from its recent lows. This recovery hints at a possible upward trajectory. Read more to find out about STRK’s 2024 price analysis.
Starknet (STRK) Price Analysis – Bollinger Bands
The Bollinger Bands are tightening, hinting at a period of low volatility in the market. This contraction often precedes a breakout, signaling a possible significant price movement on the horizon.
Currently, the STRK token is trading near the upper Bollinger Band at $0.6421. Should it break above this level, a price surge might follow. Conversely, if it fails to do so, the token could find support around the middle band at $0.5818.
Starknet (STRK) Price Analysis – Relative Strength Index
Meanwhile, the RSI index is climbing toward the neutral line, reflecting market indecision. With a reading of 46.22, the RSI suggests there is still room for a bullish push if buying pressure increases.
This movement indicates a potential shift in momentum, keeping traders on their toes for any sudden market developments.
Starknet (STRK) Price Analysis – Moving Average Convergence Divergence
On the other hand, the MACD index paints a bullish picture for the STRK token. Moving upward above the signal line suggests growing momentum in favor of further price gains.
Additionally, the MACD histogram shows green bars expanding above the zero line, signaling a strengthening bullish trend that could lead to more exciting market action.
Starknet (STRK) Price Prediction 2024
The Directional Movement Index (DMI) analysis for STRK highlights a robust trend, with an ADX value of 37.6164 emphasizing the market’s momentum. However, the current dynamics show the +DI at 17.1446 and the -DI at 21.2750, suggesting a dominant bearish trend. Despite the strength of the overall trend, STRK is experiencing significant downward pressure.
Should the bulls regain control, Starknet could break past the $1.4288 barrier, a level last seen on May 6. Overcoming this resistance might set STRK on a path toward its mid-March peak of $2.6712. On the flip side, if the bears maintain their grip, Starknet might retreat to its July low of $0.4527, seeking support to prepare for another upward attempt.
Starknet (STRK) Price Prediction 2025
As the market absorbs the bullish effects of Bitcoin’s 2024 halving, Starknet (STRK) could see substantial gains. With ongoing advancements and rising adoption, STRK’s price might target $2.00 for the minimum, $2.50 for the Average, and $5.00 for the Maximum.
Starknet (STRK) Price Prediction 2026
The following year might bring market corrections, typically seen after significant bullish runs. Yet, Starknet’s continuous innovation and expanding use cases could maintain its growth momentum. The lowest value is expected to hit $1.50. STRK’s average price could reach $2.90 and a peak of $6.00.
Starknet (STRK) Price Prediction 2027
With market stabilization and emerging new technologies, Starknet’s scalability and security features might attract more dApp developers, boosting STRK’s value: By the end of this year, STRK’s minimum price might reach $3.00, with an average cost of $5.50, and a maximum price of $8.50.
Starknet (STRK) Price Prediction 2028
As another Bitcoin halving approaches in 2028, the crypto market could enter a bullish phase once again, significantly impacting STRK’s price, which could aim for $10.00 as its peak value.
Starknet (STRK) Price Prediction 2029
After the halving, market volatility may diminish. However, the growth of Starknet’s ecosystem could continue to drive its upward trend. The minimum expense could be $7.00, the average price around $9.50, and the maximum price potentially reaching $13.00.
Starknet (STRK) Price Prediction 2030
With widespread blockchain adoption and Starknet’s stronghold as a leading ZK-Rollup solution, STRK could reach new peaks of $15.00 by 2030.
Starknet (STRK) Price Prediction 2040
By 2040, Starknet might be a well-recognized name in blockchain technology. With continuous innovation and market relevance, STRK could achieve remarkable values within tha range of $35-50.
Conclusion
Starknet (STRK), a ZK-Rollup solution, offers significant scalability and security for decentralized applications. Predictions indicate substantial growth, with price targets ranging from $1.4288 in 2024 to $15.00 by 2030 and potential values between $35-50 by 2040. With its advanced approach and robust market position, STRK is a noteworthy investment in the maturing blockchain industry. Investors should monitor its developments and market trends for informed decisions.
FAQs
Starknet is a ZK-Rollup Layer 2 network that scales decentralized applications without sacrificing security, using ZK-Rollup technology for enhanced throughput and reduced costs.
Starknet (STRK) can be purchased on major cryptocurrency exchanges that support the token. To do so, you must create an account, deposit funds, and execute a buy order.
Starknet’s innovative technology and strong market position suggest it could be a good investment, but potential investors should conduct thorough research and consider market trends.
STRK’s all-time high was $7.33, achieved on February 20, 2024.
Given the current market dynamics and historical performance, STRK will likely reach $5 in 2025.
The circulating supply of STRK is 1,460,140,491 tokens.
With favorable market conditions and continuous technological advancements, STRK has the potential to surpass its current all-time high by 2027.
The lowest price for STRK is $0.4656, recorded on July 5, 2024.
STRK was founded by Eli Ben-Sasson and a team of technologists and academics at StarkWare Industries.
STRK was launched on the Starknet Mainnet in November 2022 and became publicly available on February 20, 2024.
Starknet (STRK) can be stored in compatible cryptocurrency wallets, including hardware, software, and exchange wallets, depending on user preference and security requirements.
STRK’s price is predicted to potentially reach a minimum of $1.4288 and a peak of $2.6712 in 2024.
In 2025, STRK’s price could be $2.00 at the minimum, $2.50 at the average, and $5.00 at the maximum.
In 2026, STRK’s price might range between a low of $1.50, an average of $2.90, and a high of $6.00.
By 2027, STRK’s price might reach a minimum of $3.00, an average of $5.50, and a maximum of $8.50.
In 2028, STRK’s price could aim for a peak value of $10.00.
In 2029, STRK’s price might range from $7.00 to $13.00, with an average of around $9.50.
By 2030, STRK’s price could reach new peaks of $15.00.
By 2040, STRK could achieve remarkable values within the $35-50 range.
Disclaimer: The information presented in this article is for informational and educational purposes only. The article does not constitute financial advice or advice of any kind. Coin Edition is not responsible for any losses incurred as a result of the utilization of content, products, or services mentioned. Readers are advised to exercise caution before taking any action related to the company.


