


- SUI’s price has climbed by over 80% in the last seven days.
- Following the growth trend in the altcoin market, SEI has recorded a 16% uptick.
- However, SEI’s MACD indicator hints at the possibility of a decline.
SUI and SEI are two altcoins whose values have climbed significantly in the last week. According to data from CoinMarketCap, SUI’s price has risen by 85% in the last seven days to rank as the crypto asset with the most gains during that period. At press time, the coin exchanged hands at $1.42.
Conversely, SEI has seen its value climb by 16% during the same period. As of this writing, the coin traded at $0.72.
Demand Pushes SUI Up
SUI’s weighted sentiment observed on a seven-day moving average showed that the coin continues to enjoy a bullish momentum, according to data from Santiment. This has presented itself in the form of increased accumulation for the altcoin.
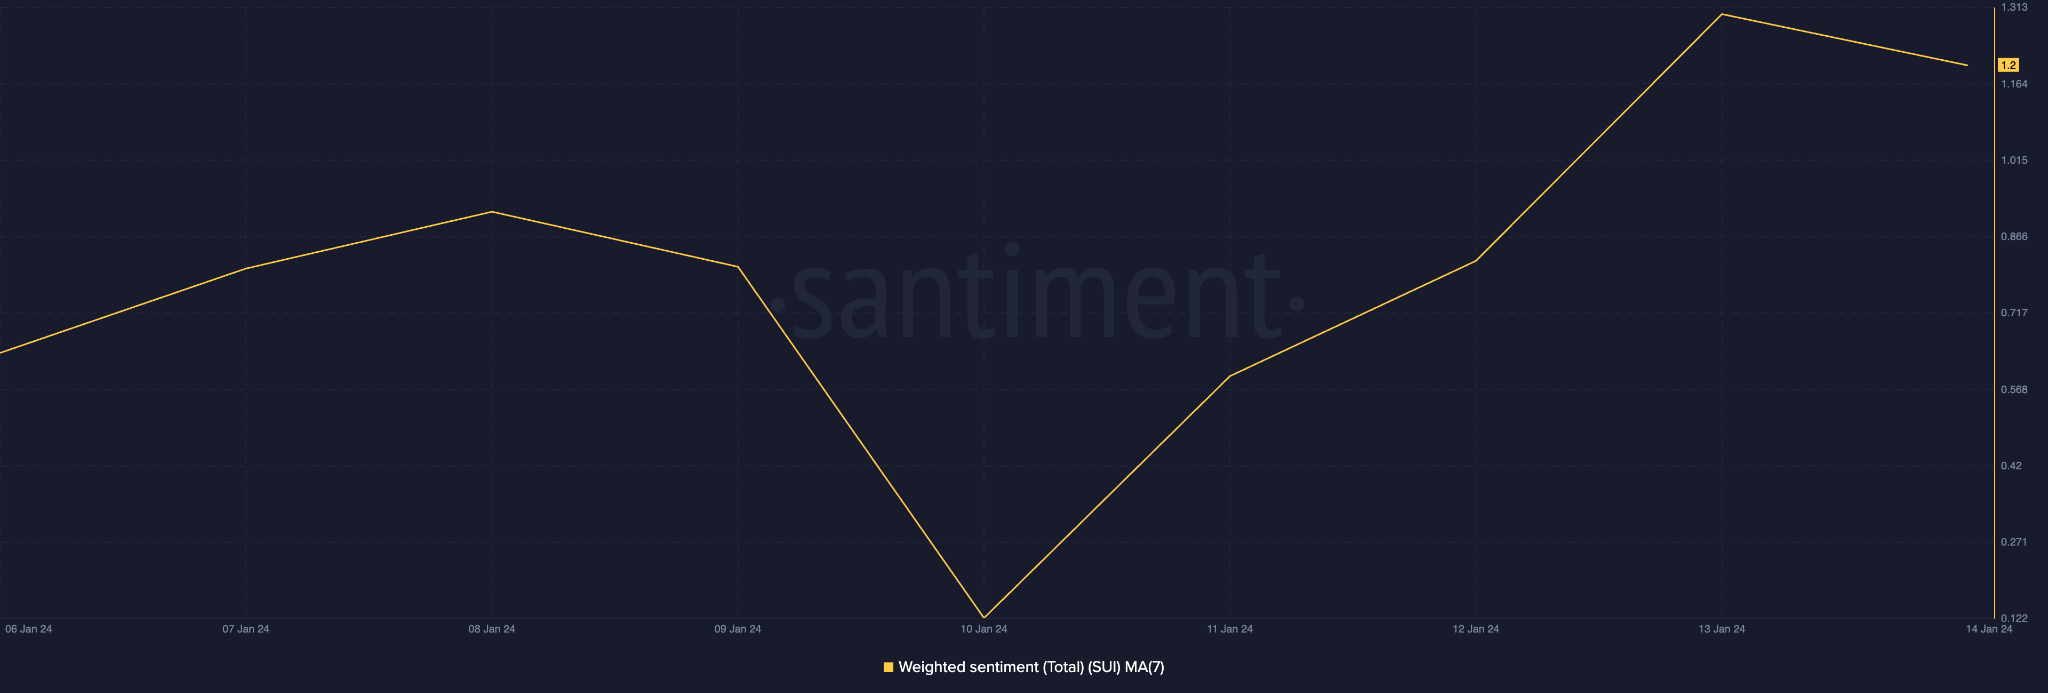
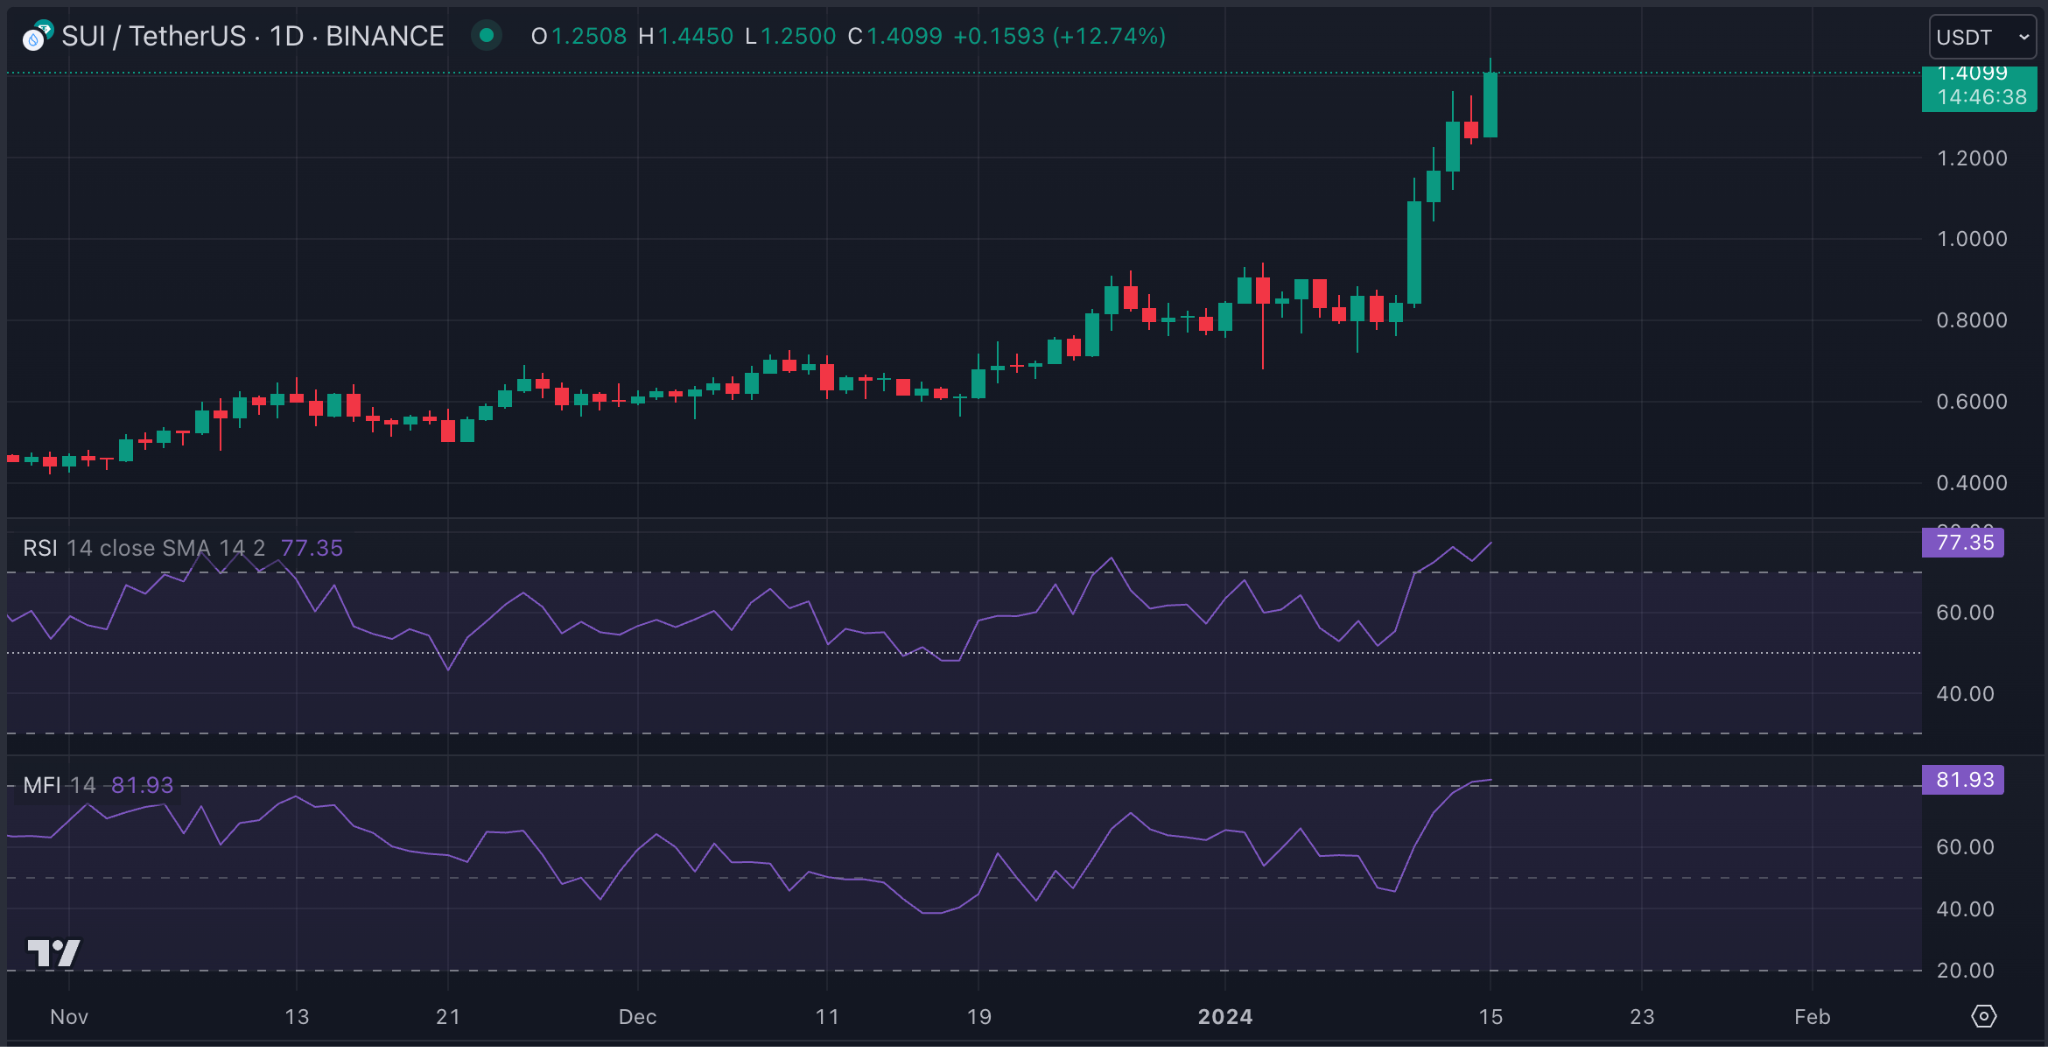
The coin’s key momentum indicators revealed that despite the double-digit rise in SUI’s value in the last week, traders continue to favor coin accumulation. For example, SUI’s Relative Strength Index (RSI) was 77.35, while its Money Flow Index (MFI) was 81.93.
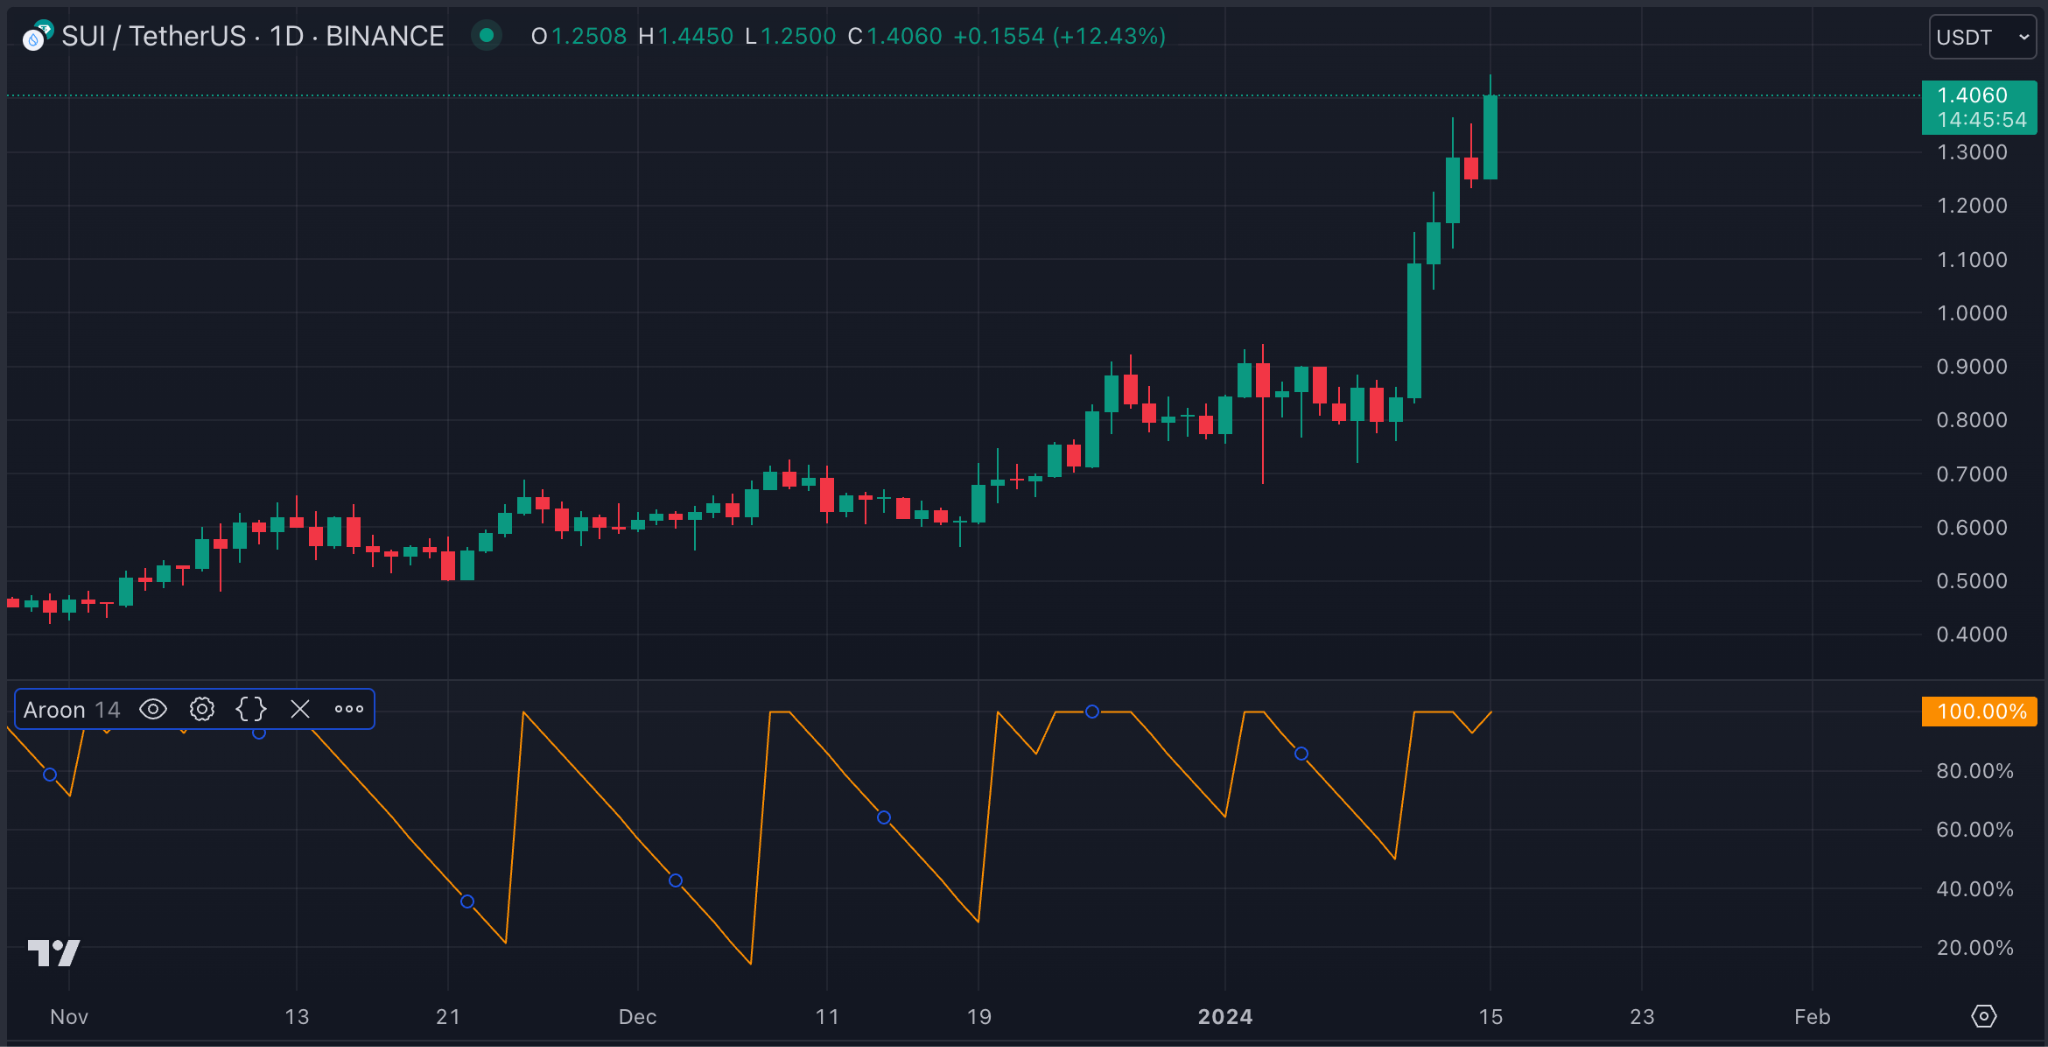
Confirming the strength of the current bullish trend, SUI’s Aroon Up Line (orange) was 100%. This indicator is used to identify trend strength and potential trend reversal points in a crypto asset’s price movement. When the Aroon Up line is close to 100, it indicates that the uptrend is strong and that the most recent high was reached relatively recently.
However, it is trite to note that at SUI’s RSI and MFI levels, the market is often deemed to be overbought. Buyers’ exhaustion is typical; hence, a reversal might be on the horizon.
SEI Sees Increased Accumulation, But There is a Catch
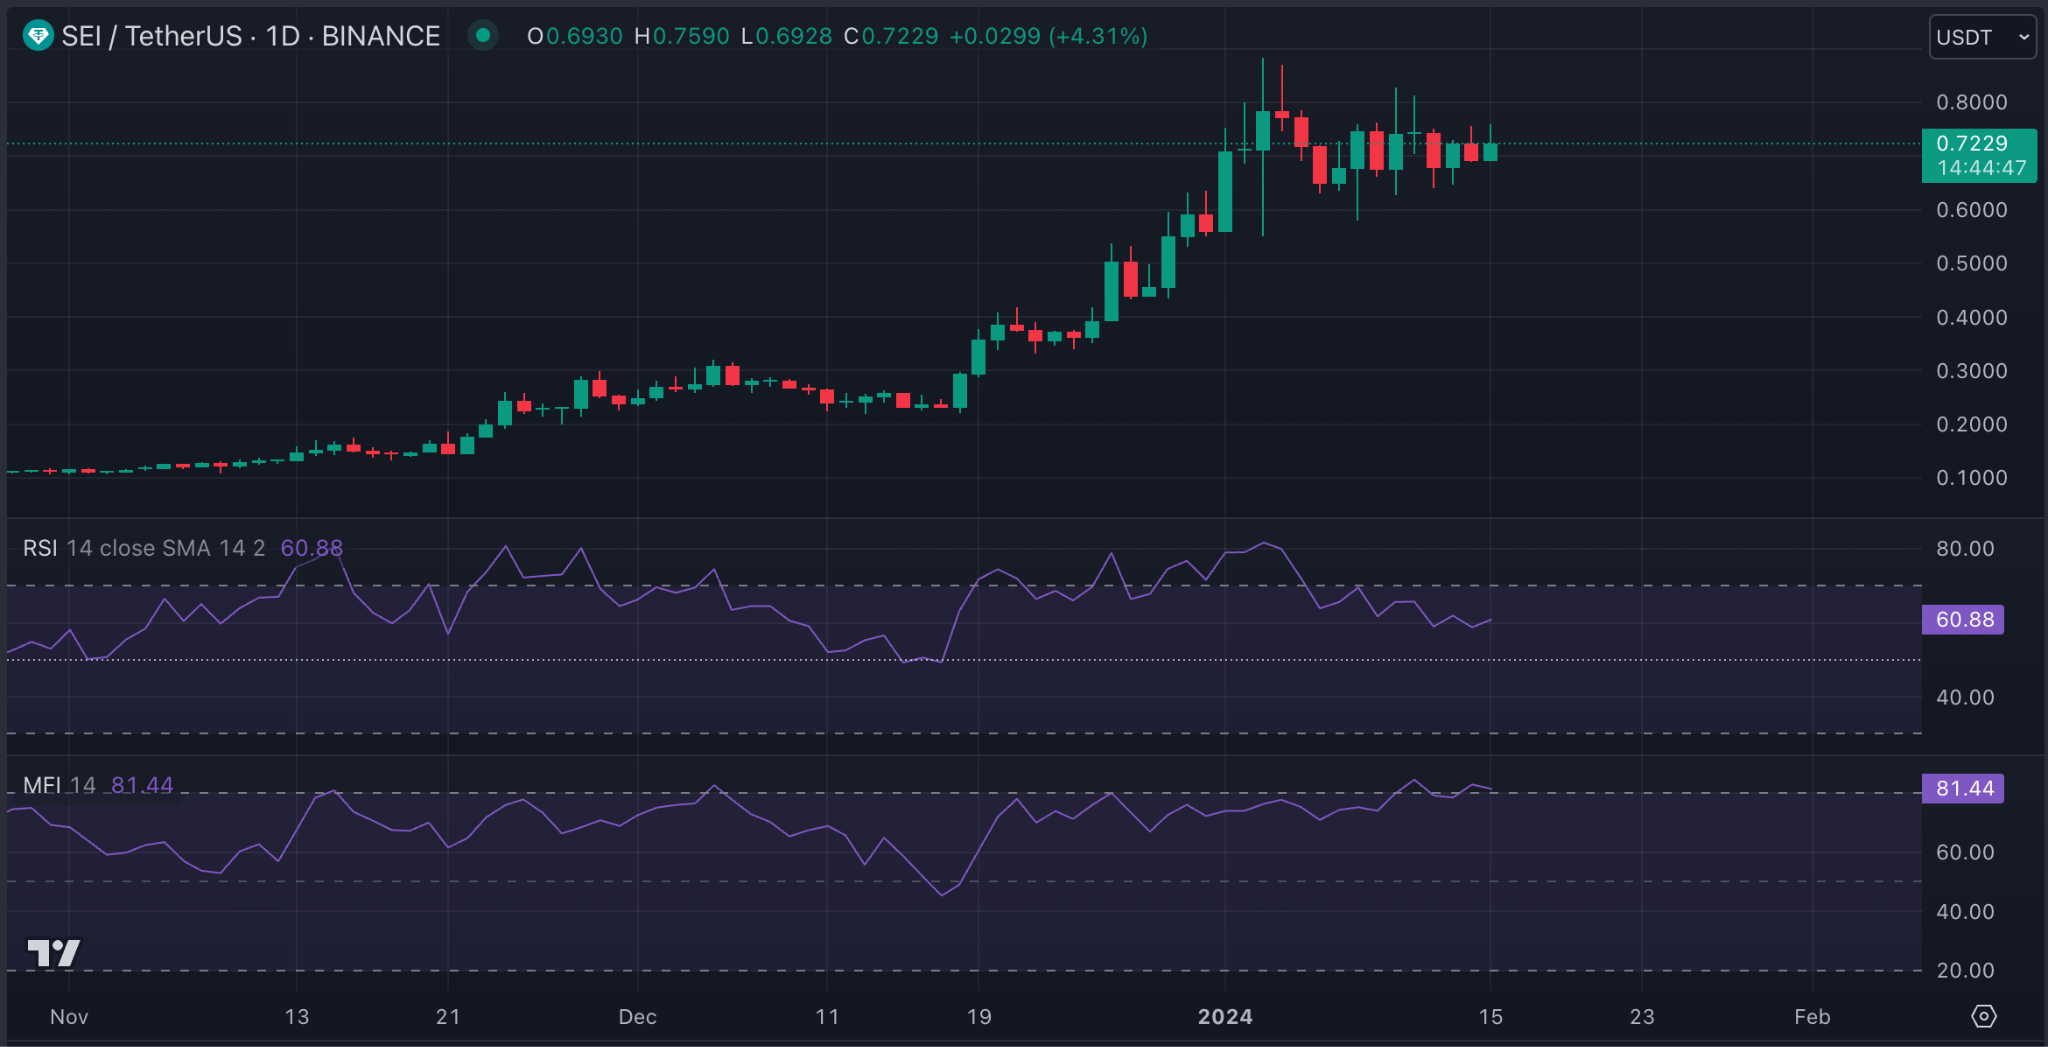
SEI’s price observed on a daily chart also revealed an uptick in coin accumulation. Its RSI and MFI rested at 60.88 and 81.44, respectively.
However, despite its price rally, readings from the coin’s Moving Average Convergence Divergence (MACD) showed that SEI’s market remained plagued by bearish sentiment.
This showed that the price rally and the uptick in coin accumulation merely mirror the general growth in the altcoin market post-ETF approval.
According to SEI’s MACD indicator, its MACD line crossed below the trend line on 11 January, causing the indicator to return only red histogram bars since then.
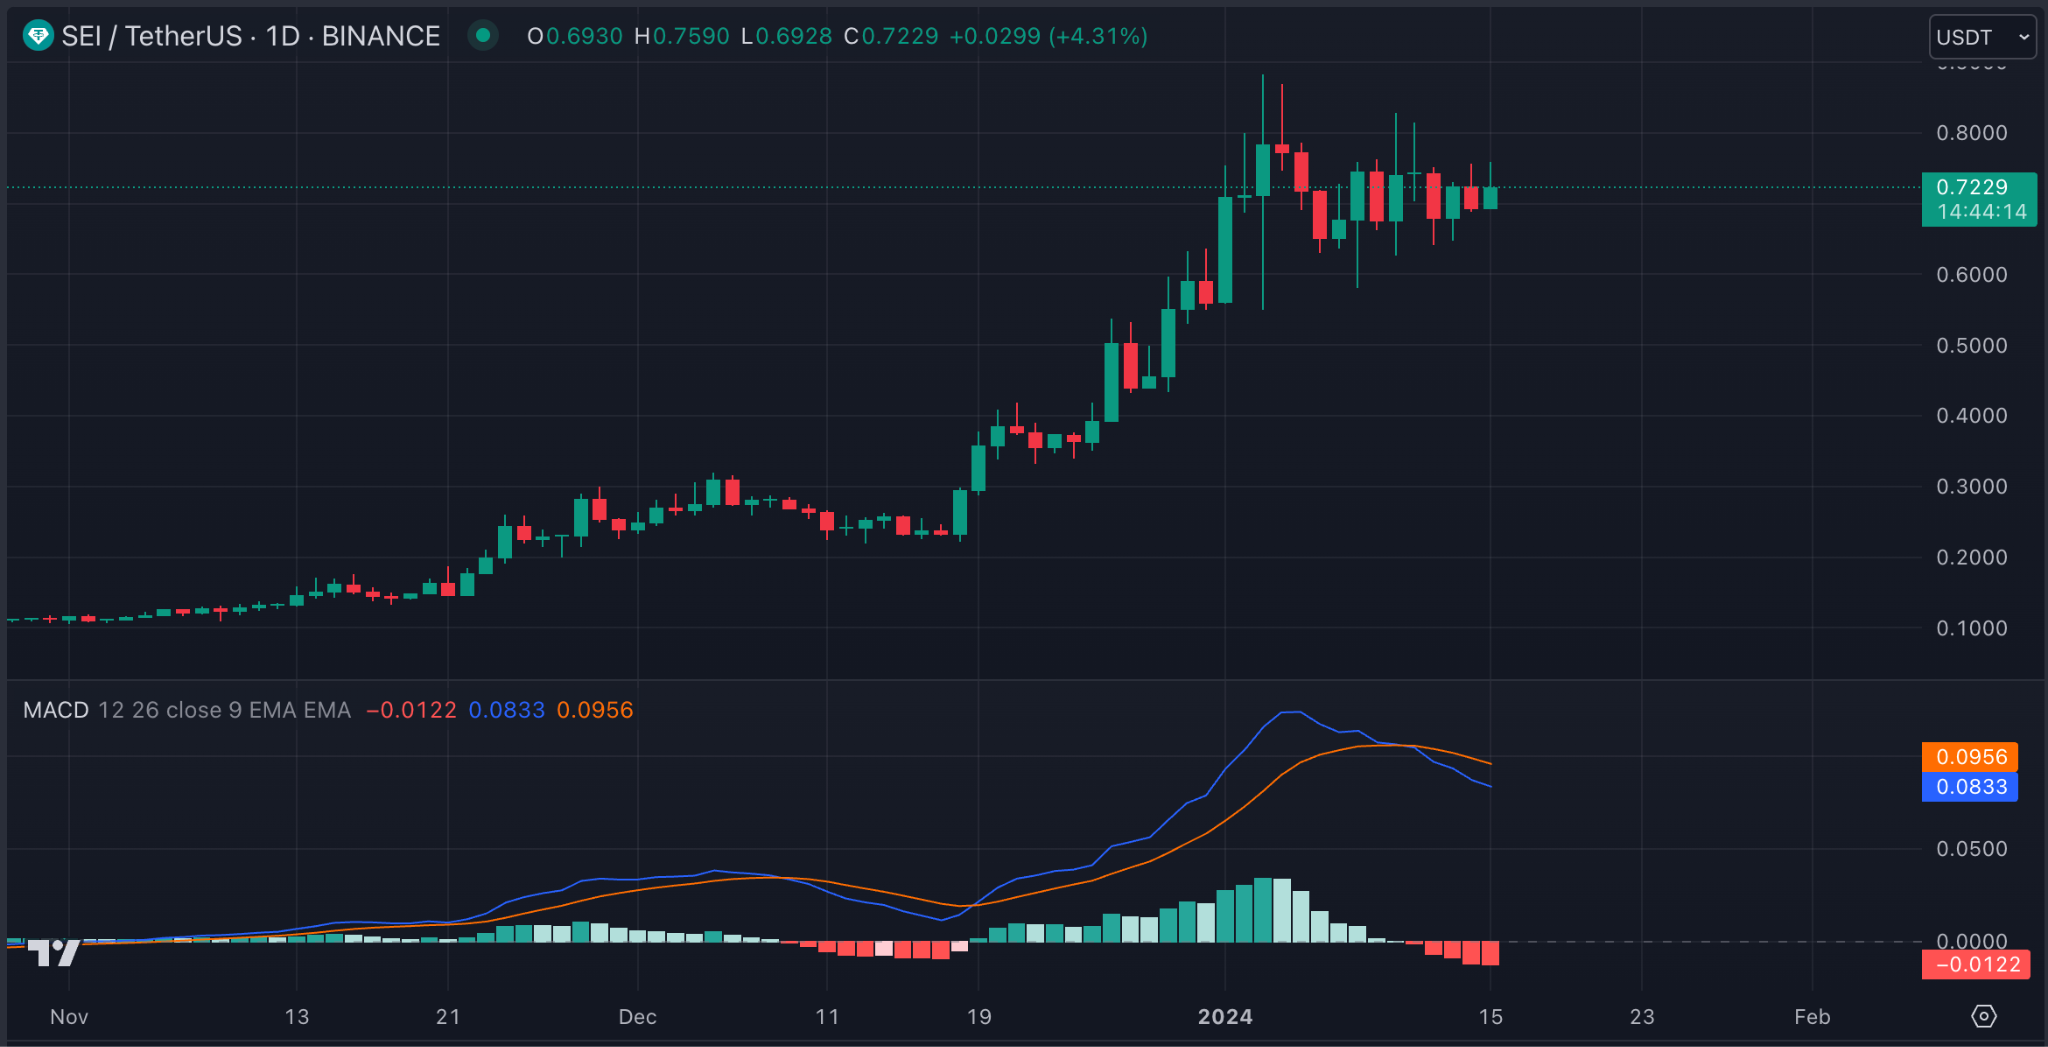
When an asset’s MACD line crosses below its trend line in this manner, it suggests the commencement of a new bear cycle.
Disclaimer: The information presented in this article is for informational and educational purposes only. The article does not constitute financial advice or advice of any kind. Coin Edition is not responsible for any losses incurred as a result of the utilization of content, products, or services mentioned. Readers are advised to exercise caution before taking any action related to the company.
 Price Prediction 2026, 2027, 2028, 2029, 2030-2050")
 Price Prediction 2026, 2027, 2028, 2029, 2030-2050")


