


- SUIUSD bears control as prices slide, cautious market sentiment prevails.
- A positive trend is expected as the SUI market shows bullish momentum.
- Potential breakout looming as SUIUSD price approaches upper Keltner Channel band.
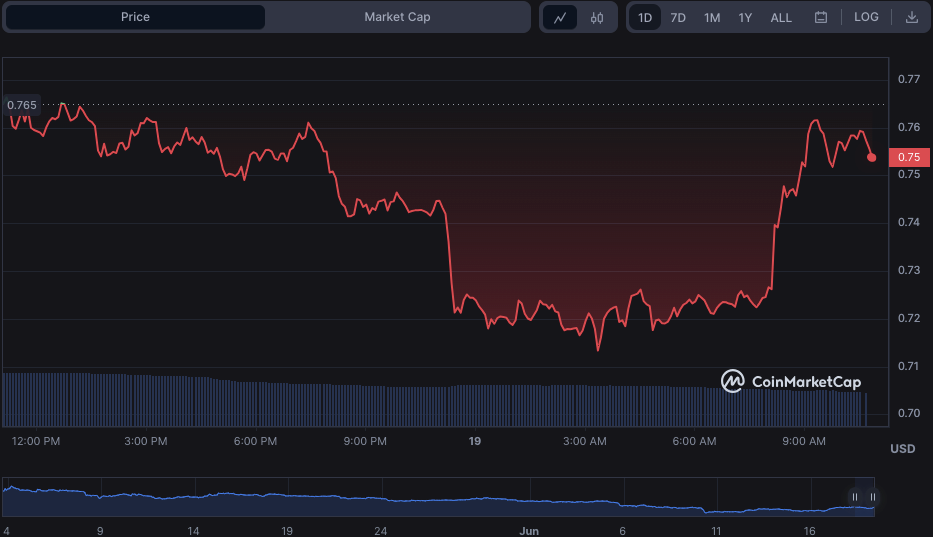
Bears have enjoyed the upper hand in the Sui (SUI) market over the past 24 hours, with prices falling from an intra-day high of $0.7664 to an intra-day low of $0.7131 (support). As of press time, the negative trend was still in control, with SUI valued at $0.7573, a 0.80% decrease from its previous closing.
Sui’s market capitalization declined by 1.16% to $456,475,920, while 24-hour trading volume plummeted by 38.09% to $209,491,156, confirming the market’s negative attitude. The drop in trading volume reflects investors’ cautious stance, who are waiting for a clear direction before making any substantial movements.
If bulls rebound and break over the $0.7664 resistance, the next resistance level would be at $0.7738, while a break below the $0.7131 support level might lead to a further slide into the $0.7000 level.
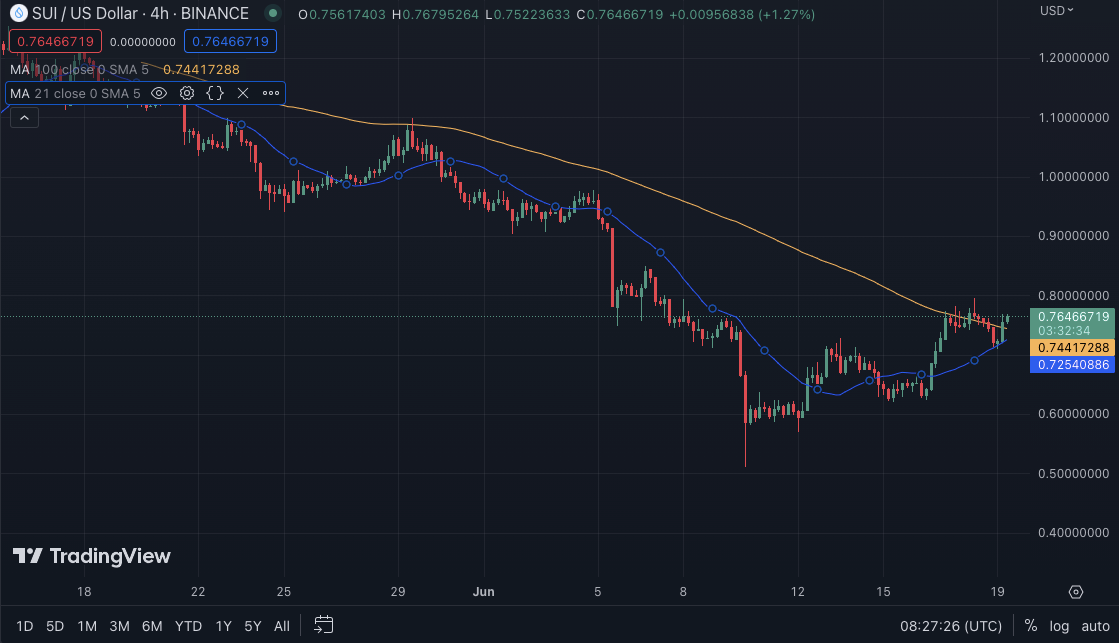
On the SUIUSD 4-hour price chart, the 100-day moving average advances above the 21-day moving average, with the former and latter readings at $0.74415611 and $0.72532896, respectively. The direction of this MA’s movement indicates a possible transition towards a more positive trend in the SUI market as the negative momentum is waning.
The price action generates green candlesticks and has pushed above the moving averages, adding to the bullish trend expectation. This positive price movement contributes to the anticipation of a more encouraging trend.
Green candlesticks imply that the closing price for a particular time frame is higher than the starting price, indicating purchasing pressure and optimistic market sentiment.
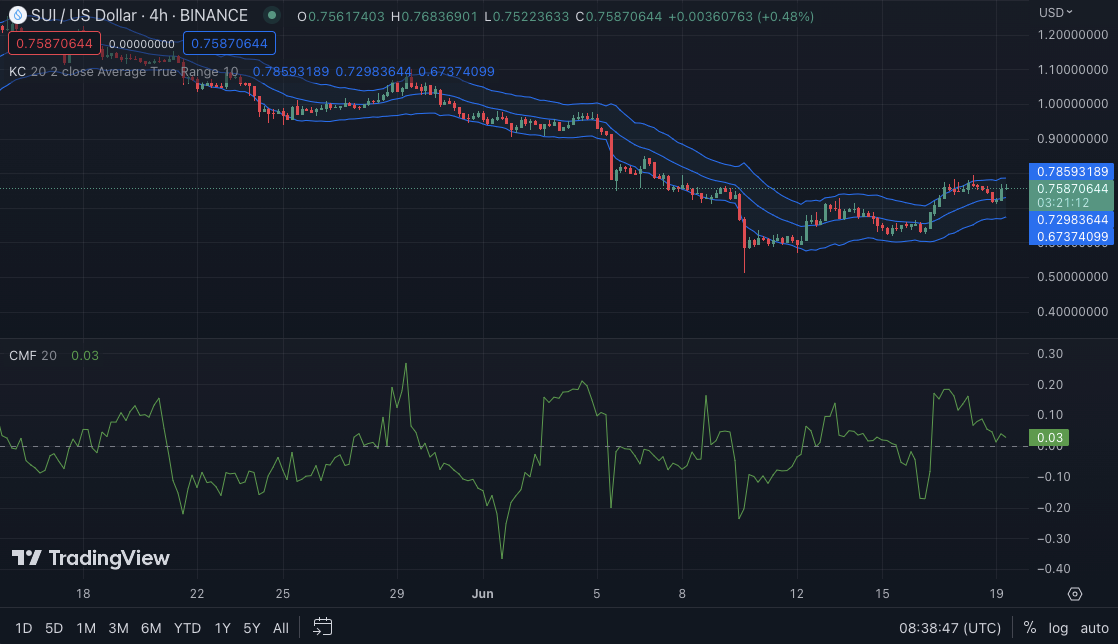
The capital inflow in the SUI market is now substantial, with the Chaikin Money Flow moving in the positive area with a value of 0.05. This movement shows that negative momentum is fading and positive sentiment is rising.
Furthermore, the Keltner Channel bands are moving upward, with the upper, middle, and lower bands touching $0.78660056, $0.73063361, and $0.67446281, respectively. This Keltner movement signals that a breakthrough is possible shortly.
The price action movement towards the upper band shows positive momentum in the SUIUSD market. Buyers are becoming more dominant as the price goes closer to the Keltner Channel’s top bar, increasing the price and perhaps leading to a breakout.
In conclusion, as bears struggle to maintain control, SUIUSD shows signs of potential reversal with increasing positive momentum, green candlesticks, and a possible breakout indicated by the Keltner Channel bands.
Disclaimer: The views, opinions, and information shared in this price prediction are published in good faith. Readers must do their research and due diligence. Any action taken by the reader is strictly at their own risk. Coin Edition and its affiliates will not be liable for direct or indirect damage or loss.
Disclaimer: The information presented in this article is for informational and educational purposes only. The article does not constitute financial advice or advice of any kind. Coin Edition is not responsible for any losses incurred as a result of the utilization of content, products, or services mentioned. Readers are advised to exercise caution before taking any action related to the company.
 Price Prediction 2026-2030: Will TRX Hit $0.50 Soon?")
 Price Prediction 2026-2050: Will HYPE Hit $100 Soon?")


: What Happens If You Use an Unlicensed Platform?")