


- Bullish SNX price prediction ranges from $2.31 to $4.28.
- SNX price might also reach $7 this 2023.
- SNX’s bearish market price prediction for 2023 is $1.481.
Synthetix (SNX) is an Ethereum-based protocol that enables the creation of synthetic assets aka Synths. Synths can be utilized as a derivative token, enabling users’ exposure to various assets. Synth trading generates a fee, which is distributed to SNX collateral providers. SNX is the native token of Synthetix Network and has a primary function of Staking and Governance within the ecosystem.
SNX tokens, claimed by the Synthetix team, help users to earn rewards from transaction fees on the Synthetix Exchange through staking. However, it still remains a question if Synthetix’s operation would drive SNX’s price upwards.
If you are curious about Synthetix (SNX)’s future, and SNX’s price forecast and analysis for 2023, 2024, 2025, 2026, and up to 2050, keep reading this Coin Edition’s price prediction article.
Table of contents
- Synthetix (SNX) Market Overview
- What is Synthetix (SNX)?
- Analyst View on Synthetix (SNX)
- Synthetix (SNX) Current Market Status
- Synthetix (SNX) Price Analysis 2023
- Synthetix (SNX) Price Prediction 2023 – 2030 Overview
- Synthetix (SNX) Price Prediction 2023
- Synthetix (SNX) Price Prediction 2024
- Synthetix (SNX) Price Prediction 2025
- Synthetix (SNX) Price Prediction 2026
- Synthetix (SNX) Price Prediction 2027
- Synthetix (SNX) Price Prediction 2028
- Synthetix (SNX) Price Prediction 2029
- Synthetix (SNX) Price Prediction 2030
- Synthetix (SNX) Price Prediction 2040
- Synthetix (SNX) Price Prediction 2050
- Conclusion
- FAQ
- More Crypto Price Predictions:
Synthetix (SNX) Market Overview
HTTP Request Failed... Error: file_get_contents(https://pro-api.coinmarketcap.com/v2/cryptocurrency/quotes/latest?slug=havven): Failed to open stream: HTTP request failed! HTTP/1.1 429 Too Many RequestsWhat is Synthetix (SNX)?
Launched in 2017 by Kain Warwick, Synthetix (SNX) is an Ethereum-based protocol that enables the creation of synthetic assets aka Synths. Specifically, Synthetix, as described on the website, is a decentralized liquidity provisioning protocol built on Ethereum and Optimistic Ethereum, which is layer 2 built on Ethereum as a scaling solution. When stakers lock SNX tokens in a staking contract and through the pooled collateral model, it allows users to perform conversions to synths without interference.
Synthetix explained that this mechanism is implemented to solve the liquidity and slippage issues experienced by DEXs.
When it comes to Synths, they can be utilized as derivative tokens. Synth trading generates a fee, which is distributed to SNX collateral providers. One of the main aims of the Synthetix protocol is to help users to get exposure to various assets via synths, without owning the asset.
Moreover, users can trade Synths on Synthetix’s decentralized exchange (DEX), Kwenta. Synthetix will help to broaden the crypto space through its Synths, enabling community access to a more robust financial market.
SNX is the native token of Synthetix Network and has a primary function of Staking and Governance within the ecosystem. For staking, SNX stakers can earn weekly rewards, which can be earned through trading fees or through inflationary rewards. Furthermore, SNX stakers also gain voting rights, which is the governance function of the token.
Furthermore, the Synthetix network has branched out across various divisions such as The Synthetix Protocol, The Synthetix Staking Interface, Synthetix Governance, Synthetix Partners & Integrators, The Greater Synthetix Ecosystem.
Analyst View on Synthetix (SNX)
Analyst also expects a bullish trend for SNX, especially since it is an Ethereum-based protocol. One crypto under the pseudonym of “Doctor Profit” announced that he had bought MATIC, SNX, and OP, which are L2 coins. The crypto analyst indicated that with the Shanghai upgrade, SNX along with other Ethereum-based tokens could experience a surge soon.
A Polygon-based community under the pseudonym “Polygonians $MATIC” proclaimed that SNX is one of the top polygon projects, according to LunarCrush Galaxy Score. This could indicate that the demand for SNX could continue to rise. Moreover, the effects of other Ethereum-based protocols could also be one of the factors that influence SNX’s price.
Synthetix (SNX) Current Market Status
According to CoinMarketCap, Synthetix (SNX) has a maximum supply of 308,069,419 SNX, while its circulating supply remains to be at 257,998,695 SNX. SNX is trading at $2.56 while experiencing an 8.24% fall in just seven days. Moreover, SNX has a market cap of $661,287,547, while facing a tumble of 4.94% in 24 hours. However, SNX has a trading volume of $37,090,130 and witnessed a surge of 0.65% in 24 hours. This could indicate that the demand for SNX is gradually rising, thus, driving the price upwards.
Traders looking forward to trading with SNX can purchase them across top crypto exchanges such as Binance, OKEx, Coinbase, Uniswap, and more. Now, let’s take a look and discuss the price analysis of Synthetix (SNX) for 2023.
Synthetix (SNX) Price Analysis 2023
According to CoinMarketCap, SNX is ranked 72 based on its market capitalization. As Synthetix (SNX) is continuously upgrading its network, will this drive SNX’s price upwards? Let’s take a look and find out in this Coin Edition price prediction article.
Synthetix (SNX) Price Analysis – Bollinger Bands
The Bollinger Bands is a technical analysis tool that is used to analyze price movement and volatility. Bollinger Bands (BB) utilizes the time period and the stand deviation of the price. Normally, the default value of BB’s period is set at 20. The Bollinger Bands consists of upper and lower bands which can be used together, along with the middle line(simple moving average), to determine whether the price would rise or fall.
The upper band of the BB is calculated by adding 2 times the standard deviations to the middle line, while the lower band is calculated by subtracting 2 times the standard deviation from the middle line. Based on the empirical law of standard deviation, 95% of the data sets will fall within the two standard deviations of the mean. As such, the prices of the cryptocurrency, when the Bollinger bands are applied should stay within the upper and lower bands 95% of the time is the concept behind this.
Looking at the chart, SNX, previously, was trading in the bottom half of the Bollinger Banders. However, SNX started to climb and is currently trading in the top half of the Bollinger Bands. This could indicate that SNX is experiencing a strong trend.
Furthermore, the upper and lower bands of the Bollinger Bands are getting narrow, indicating that SNX is experiencing low volatility. There is a possibility that SNX could be sideways for some time if the bands continue to become narrow. However, if the bands of the indicator expand, this will be a sign of an upcoming trend.
Ultimately, traders need to wait for some sign from the indicator before confirming the SNX’s sentiment.
Synthetix (SNX) Price Analysis – Relative Strength Index(RSI)
The Relative Strength Index (RSI) is a momentum indicator utilized to find out the current trend of the price movement and determine if it is in the oversold or overbought region. Traders often use this tool to make decisions about when to buy or sell the tokens. When the RSI is often valued below or at 30, it is considered an oversold region, and a price correction could happen soon. Moreover, when the RSI is valued above or at 70, it is considered as the overbought region, and traders expect the price could fall soon.
The Relative Strength Index (RSI) is currently valued at 47.02. This value could indicate that SNX is currently facing a weak trend. The chart also reveals that the RSI has never breahed the gates and entered the oversold region in 2023. However, the RSI reached the overbought region twice in 2023.
Furthermore, the RSI crossed below the SMA, which is an indication of a bearish trend. The RSI is also pointed downwards, which could be a sign that the indicator would continue to fall down. If this happens then SNX price will fall for some time.
There is still a chance that SNX may experience a trend reversal and continue to go upwards, stopping the bearish trend. Hence, traders should wait for confirmation regarding SNX’s bearish trend as there could be a possibility of a trend reversal.
Synthetix (SNX) Price Analysis – Moving Averages
The 1-day chart of SNX/USDT reveals that the candlesticks are currently trading in between the 50MA and the 200MA, a sign of consolidation. However, the 50 MA, earlier, crossed the 200 MA’s path and went above, forming a golden cross. According to most traders, the golden cross is often seen as a signal, indicating the start of a bull run. Moreover, the MA indicators are moving in a horizontal direction, making it hard to predict SNX’s market sentiment.
Therefore, traders must wait for MA indicators to make a move, before confirming SNX’s trade. If the distance between the indicators continues to widen, then, SNX could trade above the indicators, the start of a bullish era. However, if the distance between the indicators reduces, then, a bearish trend would with the formation of a death cross.
Synthetix (SNX) Price Analysis – Moving Average Convergence Divergence
The Moving Average Convergence Divergence (MACD) indicator can be used to identify potential price trends, momentums, and reversals in markets. MACD will simplify the reading of a moving average cross easier. The MACD indicator is calculated by subtracting the long-term EMA (Exponential Moving Average) indicator from the short-term EMA. Normally, the default values for the MACD are set at 12-day EMA, 26-day EMA, and 9-day EMA. Moreover, MACD is considered a lagging indicator as it cannot provide trade signals without any past price data.
Traders have reported that occasionally the Moving Average could create false signals about the price momentum, however, MACD plays an important role as it can confirm the trends and identify the potential reversals.
Furthermore, there are two methods through which traders can speculate the price’s momentum: the crossover method and the histogram method. In the crossover method, when the MACD line crosses above the signal line, the trend could change from a downtrend to a long trend. However, if MACD crosses below the signal line, this could indicate the start of a downtrend.
In the Histogram method, the bars above the signal line indicate an uptrend. Meanwhile, the Histogram bars below the signal line indicate a bearish trend.
Looking at the histogram, it shows SNX is facing a positive sign as the bars are above the signal lines. Moreover, the MACD line is above the signal, confirming SNX’s bullish trend. However, there is a chance that a trend reversal could happen soon. The MACD line is almost touching the signal line. If the MACD line crosses the signal line, then, SNX could face a bearish trend as the price continues to fall down.
Synthetix (SNX) Price Prediction 2023 – 2030 Overview
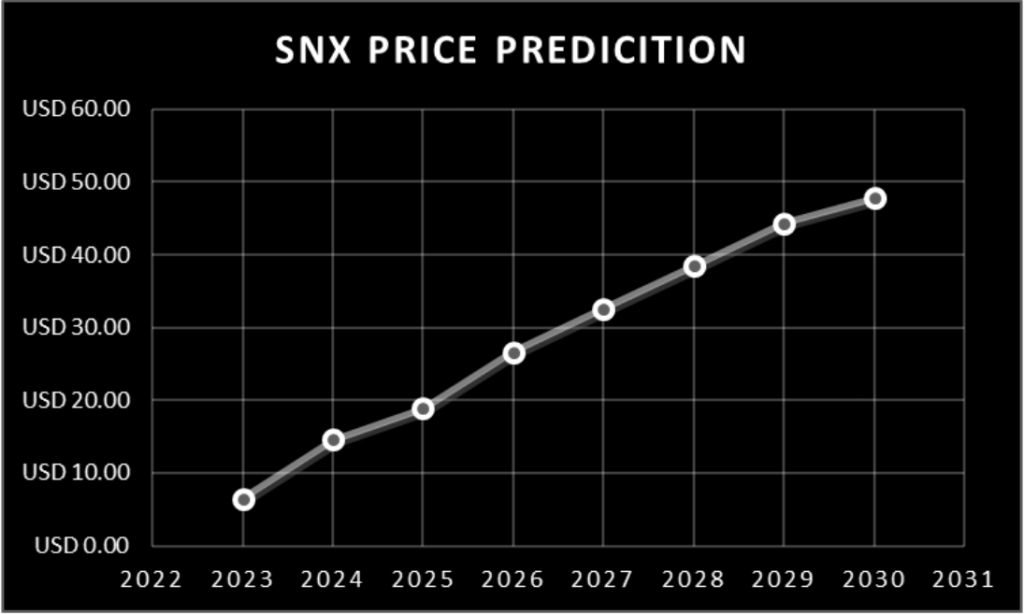
| Year | Minimum Price | Average Price | Maximum Price |
| 2023 | $1.51 | $6.51 | $8.73 |
| 2024 | $7.31 | $14.63 | $17.12 |
| 2025 | $14.40 | $18.91 | $20.25 |
| 2026 | $19.76 | $26.62 | $28.64 |
| 2027 | $27.34 | $32.59 | $35.51 |
| 2028 | $34.20 | $38.48 | $43.54 |
| 2029 | $39.77 | $44.37 | $47.56 |
| 2030 | $45.03 | $47.83 | $53.86 |
| 2040 | $70.36 | $75.62 | $79.83 |
| 2050 | $89.18 | $96.72 | $100.65 |
Synthetix (SNX) Price Prediction 2023
Looking at the chart, SNX is trading above the 200 MA, often considered a sign of bullish trend by most traders. Earlier, SNX was mostly below the 200MA, indicating a bearish sentiment. If the price continues to fall, then, SNX will be below the 200MA and will reach the support region soon.
The Relative Strength Index(RSI) is valued at 47.33, which is an indication of weak trend. Moreover, RSI has crossed the SMA going below it and is pointed downwards. This could be a sign that SNX may fall over time, and traders need to be cautious when trading SNX. However, observing the previous RSI movements, SNX hardly touched the oversold region and continues to remain within the 30-70 range. If SNX follows the previous patterns of RSI, then, it could face a fall and, once again, experience a surge.
Synthetix (SNX) Price Prediction – Support and Resistance Levels
SNX is currently trading between the Resistance 1 level and the Support. Moreover, recently, SNX broke through the Support region at $1.96. SNX was experiencing a gradual rise, however, after some time, it fell and almost touched the Support region. If the indicators prove that SNX would face a bull run in the near future, then, the candlesticks could break through the Resistance 1 region at $4.535 and even go higher and touch the Resistance 2 level at $6.650.
However, if sellers continue to sell SNX, the prices could be fazed and fall to the Support region at $1.734 or even lower.
With upcoming upgrades in tandem with expectations for bullish sentiment, SNX could be trading at $6 by the end of 2023.
Synthetix (SNX) Price Prediction 2024
Traders are looking forward to this year as it could be a historic moment for cryptocurrencies, as the Bitcoin halving is expected to happen in 2024. Most of the time, whenever BTC rises, traders have observed a similar surge in the altcoins. SNX could also be affected by Bitcoin halving and could trade beyond the price of $14 by the end of 2024.
Synthetix (SNX) Price Prediction 2025
SNX could still experience the after-effects of the Bitcoin halving and is expected to trade above its 2024 price. Many trade analysts speculate that BTC halving could create a huge impact on the crypto market. Moreover, similar to many altcoins, SNX will continue to rise in 2025 forming new resistance levels. It is expected that SNX would trade beyond the $18 level.
Synthetix (SNX) Price Prediction 2026
It is expected that after a long period of bull run, the bears would come into power and start negatively impacting the cryptocurrencies. During this bearish sentiment, SNX could tumble into its support regions. However, when SNX remains in the oversold region, there could be a price correction soon. SNX, by the end of 2026, could be trading beyond the $26 resistance level after experiencing the price correction.
Synthetix (SNX) Price Prediction 2027
Naturally, traders expect a bullish market sentiment after the crypto industry was affected negatively by the bears’ claw. SNX is expected to rise after its slumber in the bear season. Moreover, SNX could even break more resistance levels as it continues to recover from the bearish run. Therefore, SNX is expected to trade at $32 by the end of 2027.
Synthetix (SNX) Price Prediction 2028
Once again, the crypto community is looking forward to this year as there will be a Bitcoin halving. Alike many altcoins, SNX will continue to form new higher highs and is expected to move in an upward trajectory. Hence, SNX would be trading at $38 after experiencing a massive surge by the end of 2028.
Synthetix (SNX) Price Prediction 2029
2029 is expected to be another bull run due to the aftermath of the BTC halving. However, traders speculate that the crypto market would gradually become stable by this year. In tandem with the stable market sentiment and the slight price surge expected after the aftermath, SNX could be trading at $44 by the end of 2029.
Synthetix (SNX) Price Prediction 2030
After witnessing a bullish run in the market, SNX and many altcoins would show signs of consolidation and might trade sideways for some time while experiencing minor spikes. Therefore, by the end of 2030, SNX could be trading at $47.
Synthetix (SNX) Price Prediction 2040
The long-term forecast for SNX indicates that this altcoin could reach a new all-time high(ATH). This would be one of the key moments as HODLERS may expect to sell some of their tokens at the ATH point. However, SNX may face a slight fall before starting its upward journey once again. It is expected that the average price of SNX could reach $75 by 2040.
Synthetix (SNX) Price Prediction 2050
The community believes that there will be widespread adoption of cryptocurrencies, which could maintain gradual bullish gains. By the end of 2050, if the bullish momentum is maintained, SNX could surpass the resistance level of $96.
Conclusion
To summarize, SNX has the potential to rise up in the future as new developments and upgrades are deployed in the crypto space. If the community continues to believe in SNX’s bullish sentiment and adds the altcoin to their investment portfolio, the price might reach $6 by the end of 2023. Moreover, SNX could surpass the $96 resistance level by the end of 2050.
FAQ
Synthetix (SNX) is the native token of the Synthetix protocol. It is an ERC-20 token.
Like other cryptocurrencies, Synthetix (SNX) can be traded in cryptocurrency exchanges like Binance, Huobi Global, Kucoin, Gate.io, and others.
Synthetic has a possibility of surpassing its present all-time high (ATH) price of $28.77 in 2026.
Since SNX has proved that investors are showing a huge demand in tandem with the upcoming developments, this altcoin has the potential to become one of the best investments in 2023. Moreover, its current trend could break the resistance levels forming new higher highs.
It was launched in September 2017.
SNX is expected to reach $6 by 2023.
SNX is expected to reach $14 by 2024.
SNX is expected to reach $18 by 2025.
SNX is expected to reach $26 by 2026.
SNX is expected to reach $32 by 2027.
SNX is expected to reach $38 by 2028.
SNX is expected to reach $44 by 2029.
SNX is expected to reach $47 by 2030.
SNX is expected to reach $75 by 2040.
SNX is expected to reach $96 by 2050.
Disclaimer: The views and opinions, as well as all the information shared in this price prediction, are published in good faith. Readers must do their research and due diligence. Any action taken by the reader is strictly at their own risk. Coin Edition and its affiliates will not be held liable for any direct or indirect damage or loss.
More Crypto Price Predictions:
- Aave (AAVE) Price Prediction 2023-2030
- Maker (MKR) Price Prediction 2023-2030
- eCash (XEC) Price Prediction 2023-2030
- Huobi Token (HT) Price Prediction 2023-2030
Disclaimer: The information presented in this article is for informational and educational purposes only. The article does not constitute financial advice or advice of any kind. Coin Edition is not responsible for any losses incurred as a result of the utilization of content, products, or services mentioned. Readers are advised to exercise caution before taking any action related to the company.


