


- Investor confidence in the VET market has led to a price increase of $0.01556.
- Traders should beware, as technical indications suggest a potential trend reversal on the verge.
- Despite warnings from market indicators, bulls maintain their supremacy.
Since the beginning of the day, buyers of VeChain (VET) have been in control, erasing the effects of the negative trend that had driven prices down to support at 0.01543. Despite being met with resistance at the day’s intraday high of $0.01583, the bulls were able to push the value of VET up to $0.01556 (a 0.04% increase), at the time of writing.
The positive control boosted the capitalization by 0.07% to $1,128,361,563, while the 24-hour trading view fell short by 2.86% to $26,664,259. This decrease in volume may indicate that it is the time to sell and profit in VET.
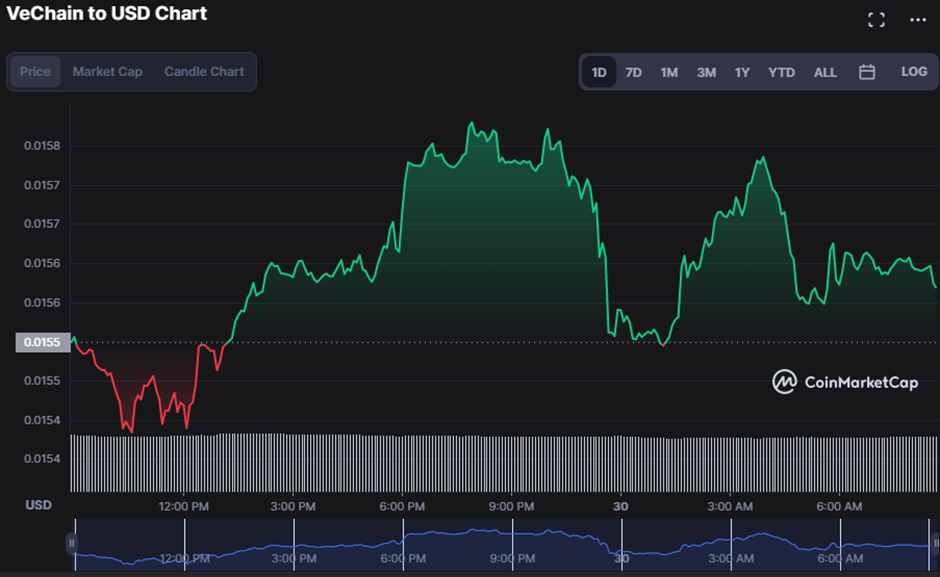
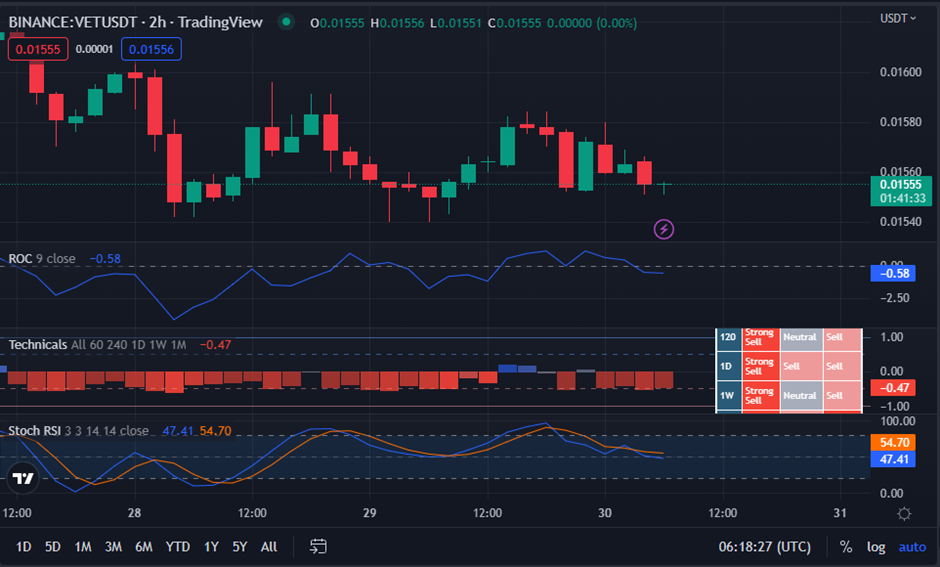
An engulfing green candlestick on the VET price chart indicates growing investor confidence that the market’s recent upswing will be sustained. The ROC curve shows that this hypothesis is a fault since it slopes downwards below the 0 line. When it points below zero and begins to move in the negative zone at a reading of -0.58, investors should be wary that the upward price trend may come to an end.
Because of the “strong sell signal” from the Technical Ratings indicator, it seems that the current rally in VET will soon come to an end. The technical ratings have entered the red zone, at -0.47, confirming the end of the optimistic assumption supporting the VeChain market.
Concern among traders is further heightened by the fact that the stochastic RSI has dropped below the signal line and is approaching the oversold area with a reading of 48.52, all of which point to a likely reversal. Below 20 on the stochastic RSI, traders should be wary that the market may have already reached the top of the current uptrend.
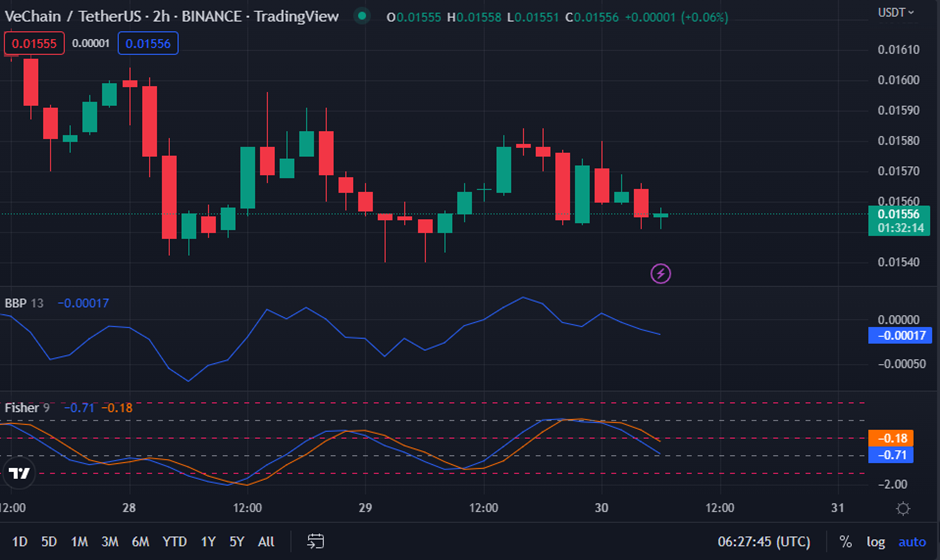
The Bull Bear Power (BBP) indicator has been trending downward, providing more evidence that the optimistic outlook underpinning VET is beginning to subside. The indicator’s value of -0.00016 suggests that bullish dominance is losing steam, warning traders to keep an eye out for a probable trend reversal.
When the Fisher Transform crosses below its signal line and into the negative region, as it has done recently (with a reading of -0.71), it warns that bear power is on the horizon, rendering bullish sentiment in VET futile.
Maintaining the VET market’s upward trend requires bulls to push prices over the resistance level.
Disclaimer: The views and opinions, as well as all the information shared in this price analysis, are published in good faith. Readers must do their own research and due diligence. Any action taken by the reader is strictly at their own risk, Coin Edition and its affiliates will not be held liable for any direct or indirect damage or loss
Disclaimer: The information presented in this article is for informational and educational purposes only. The article does not constitute financial advice or advice of any kind. Coin Edition is not responsible for any losses incurred as a result of the utilization of content, products, or services mentioned. Readers are advised to exercise caution before taking any action related to the company.
 Price Prediction 2026, 2027, 2028, 2029, 2030 -2050")


