- BTC occupies the number 2 spot on CoinMarketCap’s trending list.
- The price of the market leader is down around 0.18% over the last 24 hours.
- Technical indicators on BTC’s daily and 4-hour charts are flagging bearish.
Number 2 on CoinMarketCap’s trending list and the crypto market leader in terms of market cap, Bitcoin (BTC), has seen its price drop slightly over the last 24 hours. According to CoinMarketCap, the price of BTC has dipped 0.18% over the last 24 hours – bringing its price down to $16,798.97 at press time.

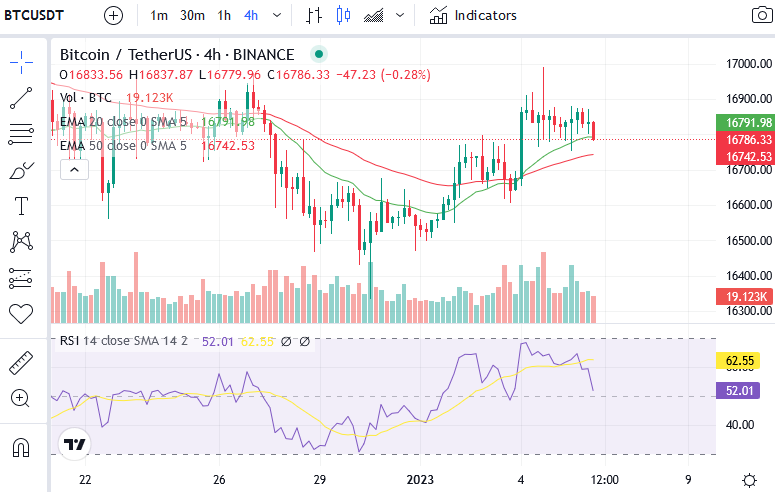
The 4-hour chart for BTC/USDT shows that the crypto market leader’s price is resting on the 20 EMA line. This EMA line is currently positioned above the 4-hour 50 EMA line and is providing support to BTC at press time. This support may, however, fail to hold as the 4-hour RSI indicator is flagging very bearish.
Currently, the 4-hour RSI SMA line has crossed below the 4-hour RSI SMA line. In addition to this, the RSI line has a steep negative slope. This suggests that BTC’s price will continue falling in the next 4-12 hours.
Additional downward price movement will drag BTC’s price down to the next support level at the 50-EMA level, which is around $16,738.46.

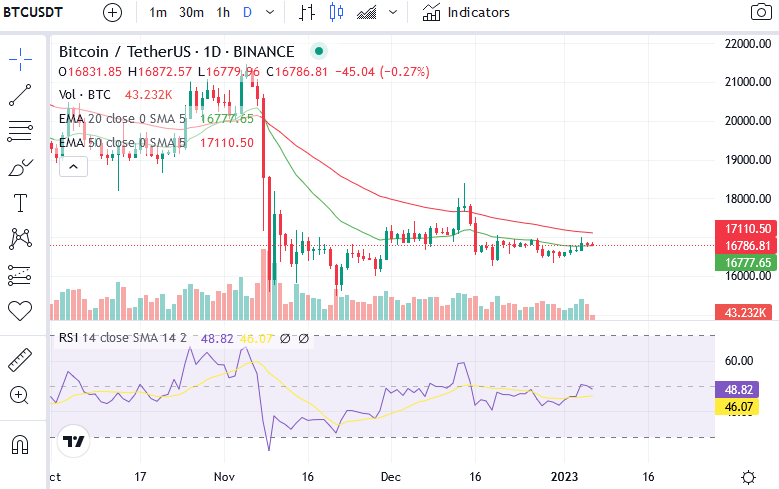
The daily chart for BTC/USDT expresses the same bearishness on BTC’s 4-hour chart. Similar to the 4-hour chart, BTC’s price is resting on the 20-day EMA line. The daily RSI indicator is also showing bearishness as the daily RSI line is sloped negatively towards the oversold territory.
A confirmation of the bearish thesis will be when the daily RSI line crosses below the daily RSI SMA line before the closing of tomorrow’s trading session. This will justify the belief that BTC’s price will drop towards the 50 EMA line on its 4-hour chart.
Disclaimer: The views and opinions, as well as all the information shared in this price analysis, are published in good faith. Readers must do their own research and due diligence. Any action taken by the reader is strictly at their own risk. Coin Edition and its affiliates will not be held liable for any direct or indirect damage or loss.
Disclaimer: The information presented in this article is for informational and educational purposes only. The article does not constitute financial advice or advice of any kind. Coin Edition is not responsible for any losses incurred as a result of the utilization of content, products, or services mentioned. Readers are advised to exercise caution before taking any action related to the company.


