


- MATIC faces resistance at $0.5807 but hints at a bullish reversal.
- Polygon’s trading volume spikes by 16.5% amid price pullback.
- The upward RSI trend suggests a potential shift to bullish momentum.
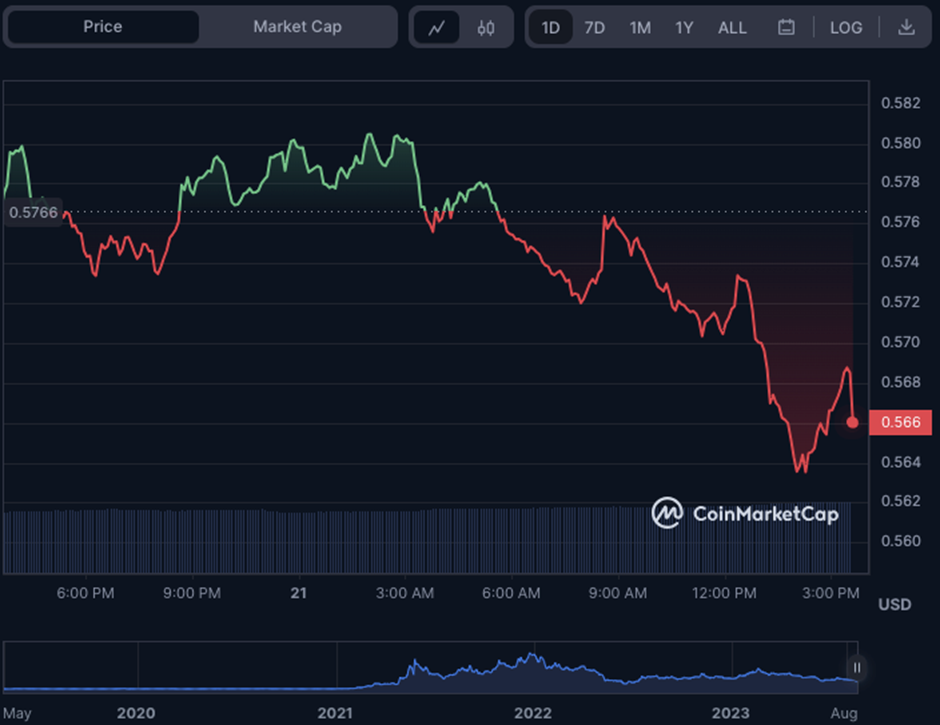
Despite enjoying a promising bull rally at the start of the day, Polygon’s (MATIC) price experienced a pullback after failing to overcome the resistance level at $0.5807. Consequently, the price dipped to an intra-day low of $0.5635 before a modest recovery. MATIC was valued at $0.5687 at press time, showcasing a mild rebound from the day’s low point.
The dip in price saw MATIC’s market capitalization decline by 1.73% to $5,299,919,552. However, the 24-hour trading volume increased by an impressive 16.50% to $250,372,453, signaling heightened trading activity.
This price retracement is likely due to profit-taking by investors who capitalized on the earlier bull rally. Yet, the subtle price recovery indicates persistent buying interest in MATIC, suggesting a potential for further price movement.
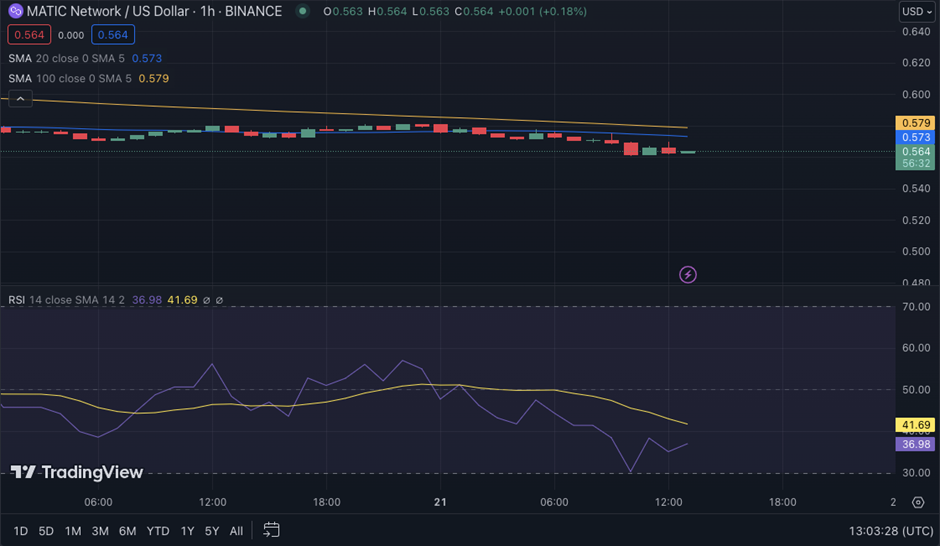
On the MATICUSD 2-hour price chart, the 20-day moving average (blue) is positioned below the 100-day moving average (orange), with the former and latter currently touching $0.575 and $0.618, respectively. This trend suggests a possible bearish signal, as the shorter-term moving average crossing below the longer-term moving average is commonly interpreted as a sign of downward momentum.
However, the recent price action shows the formation of green candlesticks as it approaches the 20-day MA, implying that buyers are entering the market to support the price. If this buying pressure persists and the price successfully rebounds from the 20-day MA, it could indicate a potential reversal in the bearish trend.
Adding to this optimistic outlook, the Relative Strength Index (RSI) is moving upwards with a reading of 40.09, indicating a possible weakening of selling pressure and a shift towards bullish momentum. If this RSI trend continues, we may see an increase in buying activity and a potential reversal of the bearish trend.
In conclusion, MATIC’s price dip faces bullish potential as buying interest persists despite retracement, supported by moving averages and RSI rising trend.
Disclaimer: The views, opinions, and information shared in this price prediction are published in good faith. Readers must do their research and due diligence. Any action taken by the reader is strictly at their own risk. Coin Edition and its affiliates will not be liable for direct or indirect damage or loss.
Disclaimer: The information presented in this article is for informational and educational purposes only. The article does not constitute financial advice or advice of any kind. Coin Edition is not responsible for any losses incurred as a result of the utilization of content, products, or services mentioned. Readers are advised to exercise caution before taking any action related to the company.


