


- Ali Martinez predicted in an X post yesterday that XRP may fall to $0.55 soon.
- The analyst shared that XRP was rejected from the middle line of an ascending channel.
- A descending triangle on XRP’s daily chart also suggests XRP may drop in the next 48 hours.
The well known cryptocurrency analyst and trader Ali Martinez shared in an X post yesterday that the price of XRP could be at risk of dropping in the next few days. This prediction came after the remittance token got rejected from the middle line in an ascending parallel channel that it has recently been trading in on its 3-day chart.
Martinez stated that he believes the price of XRP could face a drop to $0.55. His bearish prediction seems to have set in motion in the past 24 hours. Data from the cryptocurrency market tracking website CoinMarketCap indicated that the remittance token dropped 2.03% throughout the past day of trading.\
Following the 24-hour loss, XRP’s price stood at $0.6072 at press time. The latest decrease in the altcoin’s price also pushed the cryptocurrency’s weekly performance further into the red zone. As a result, XRP was down 3.25% on the weekly timeframe as well.
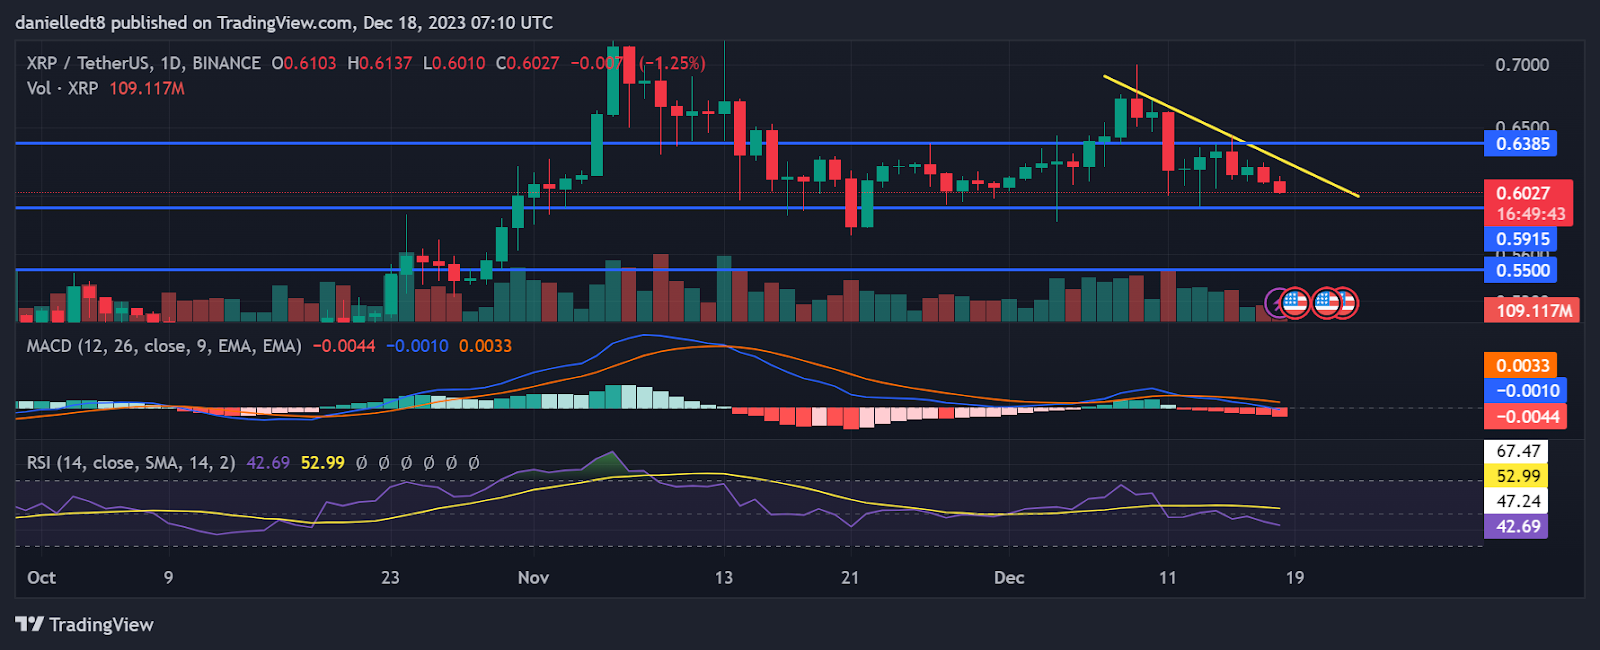
From a technical standpoint, a descending triangle has formed on XRP’s daily chart as well. This was after the cryptocurrency printed a series of lower highs in the past week. Traders and investors will want to keep an eye on the base of the triangle pattern at $0.5915. XRP falling below this level may be followed by it dropping to the $0.55 mark in the short term.
This bearish thesis may be invalidated if XRP is able to maintain a position above the $0.5915 support for the next five days. In this more bullish scenario, XRP could attempt to rise to $0.6385 in the following week.
Both the Moving Average Convergence Divergence (MACD) and the Relative Strength Index (RSI) indicators were also flagging bearish on XRP’s daily chart. The MACD line was positioned below the MACD Signal line, while the RSI line was positioned below the RSI Simple Moving Average (SMA) line. These technical flags suggest XRP’s price may continue to fall.
Disclaimer: The information presented in this article is for informational and educational purposes only. The article does not constitute financial advice or advice of any kind. Coin Edition is not responsible for any losses incurred as a result of the utilization of content, products, or services mentioned. Readers are advised to exercise caution before taking any action related to the company.
 Price Prediction 2026, 2027, 2028, 2029, 2030-2050")


