 Price Prediction 2025-2030: Will GRT Reach New Highs?")
- GRT is projected to trade between $0.60 and $1.05 in 2025, with potential bullish momentum driving it toward higher resistance levels.
- The token is expected to surpass $2.20 by 2027, fueled by institutional adoption and expanded blockchain indexing capabilities.
- By 2030, GRT could reach $3.65, driven by mass adoption in Web3 applications and increasing demand for decentralized data solutions.
The Graph is a decentralized indexing protocol designed for querying blockchain data efficiently. It enables developers to access and organize on-chain data, making it easier to build decentralized applications (dApps) without relying on centralized servers. The protocol allows users to create and query subgraphs, which function as open APIs that index blockchain data for easy retrieval.
Launched on the Ethereum blockchain in December 2020, The Graph is often compared to Google for blockchains due to its ability to categorize and structure decentralized data. It supports multiple blockchains, including Ethereum, Arbitrum, Avalanche, Celo, Optimism, and Polygon, with plans to expand its coverage.
Table of contents
- The Graph (GRT) Current Market Status
- The Graph (GRT) Price Prediction 2025-2030 Overview
- Key Features of The Graph
- Bollinger Band Analysis for The Graph (GRT)
- MACD Analysis for The Graph (GRT)
- Relative Strength Index (RSI) Analysis for The Graph (GRT)
- Support and resistance levels for The Graph (GRT)
- The Graph (GRT) 2025 Price Prediction Analysis
- The Graph (GRT) Price Prediction for 2026
- The Graph (GRT) Price Prediction for 2027
- The Graph (GRT) Price Prediction for 2028
- The Graph (GRT) Price Prediction for 2029
- The Graph (GRT) Price Prediction for 2030
- FAQs
The Graph (GRT) Current Market Status
| Name | The Graph |
| Symbol | GRT |
| Rank | 64 |
| Price | $0.1347 |
| Price Change (24h) | -8.38% (1d) |
| Price Change (7d) | -6.99% (7d) |
| Market Cap | $1.28B |
| Circulating Supply | 9.54B GRT |
| Total Supply | 10.79B GRT |
The Graph (GRT) Price Prediction 2025-2030 Overview
| Year | Lowest Price ($) | Average Price ($) | Highest Price ($) |
| 2025 | 0.6 | 0.85 | 1.05 |
| 2026 | 1.05 | 1.3 | 1.82 |
| 2027 | 1.62 | 1.8 | 2.2 |
| 2028 | 2.15 | 2.35 | 2.75 |
| 2029 | 2.35 | 2.8 | 3.3 |
| 2030 | 3.15 | 3.3 | 3.65 |
Key Features of The Graph
- Decentralized indexing – Unlike centralized data providers, The Graph ensures blockchain data remains transparent, secure, and censorship-resistant.
- Scalability and multi-chain support – Initially built for Ethereum, The Graph now indexes data from multiple blockchains, improving interoperability.
- Efficient data retrieval – By using subgraphs, developers can access blockchain data quickly without running full nodes, reducing infrastructure costs.
- Incentive-driven ecosystem – Indexers, curators, and delegators all contribute to the network’s efficiency while earning GRT rewards.
- Security and reliability – The network ensures high uptime and data accuracy through a Proof-of-Stake (PoS) mechanism and slashing penalties for malicious actors.
Bollinger Band Analysis for The Graph (GRT)
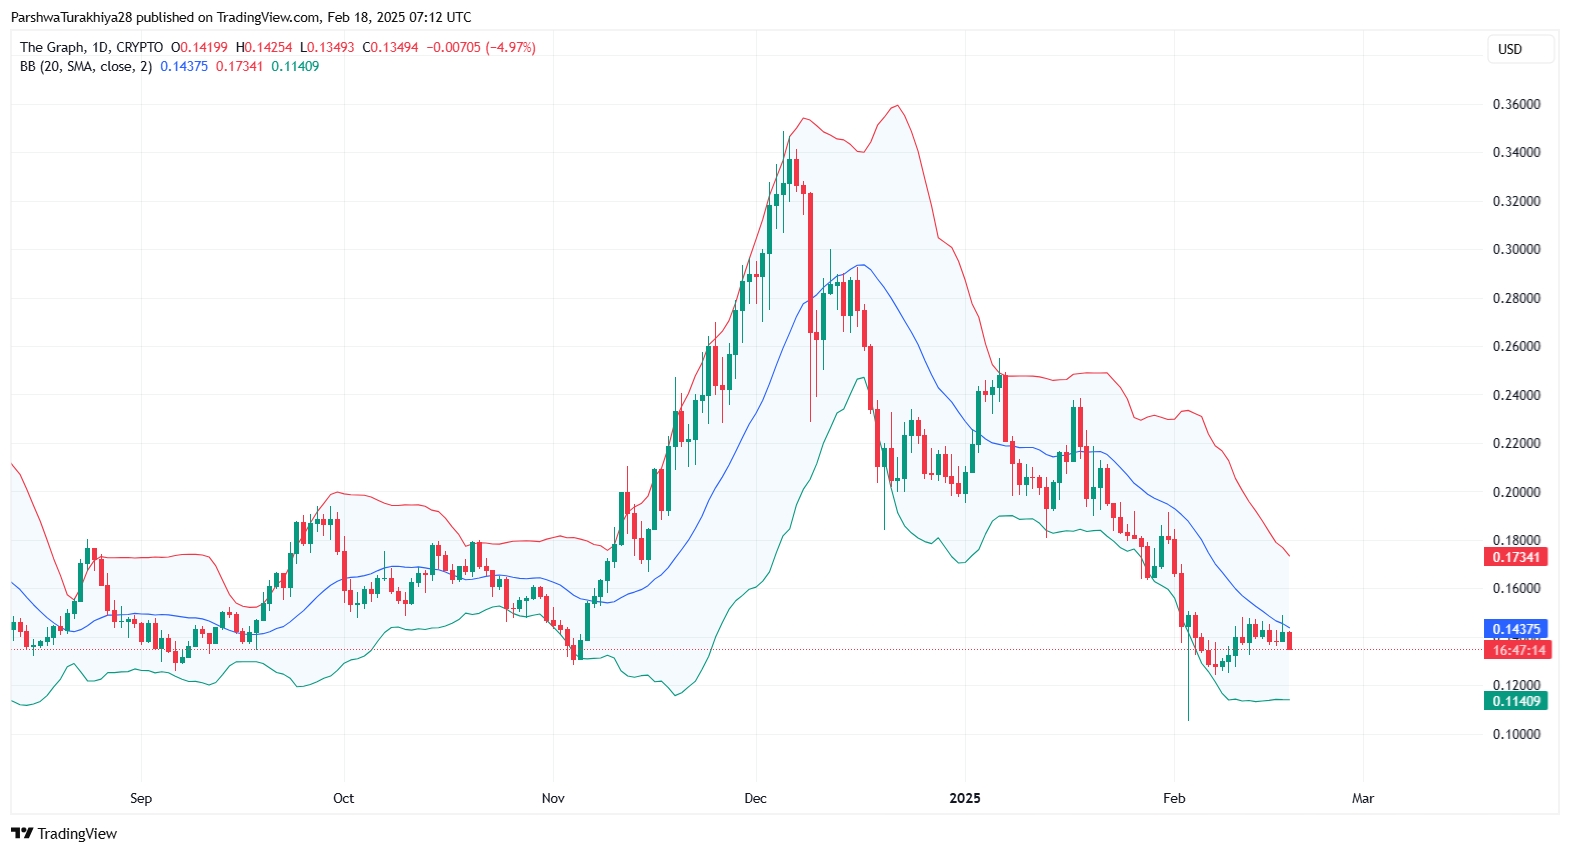
The Bollinger Bands analysis for The Graph (GRT) on the daily timeframe suggests a period of heightened volatility. The current price is around $0.1354, trading near the lower Bollinger Band at $0.1141, while the middle band (20-day simple moving average) stands at $0.1437, and the upper band is at $0.1734. The price recently tested the lower band, signaling stGRTUSDg bearish pressure, but has since shown signs of stabilization.
A sustained move above the middle band could indicate the beginning of a recovery, targeting resistance around $0.17. However, failure to maintain support above $0.12 may result in further downside movement. The bands are still widening, reflecting ongoing volatility, which could lead to sharp price fluctuations. Traders should watch for a breakout above $0.145, as it may confirm a bullish reversal, while continued rejection from the middle band could reinforce the bearish sentiment.
MACD Analysis for The Graph (GRT)
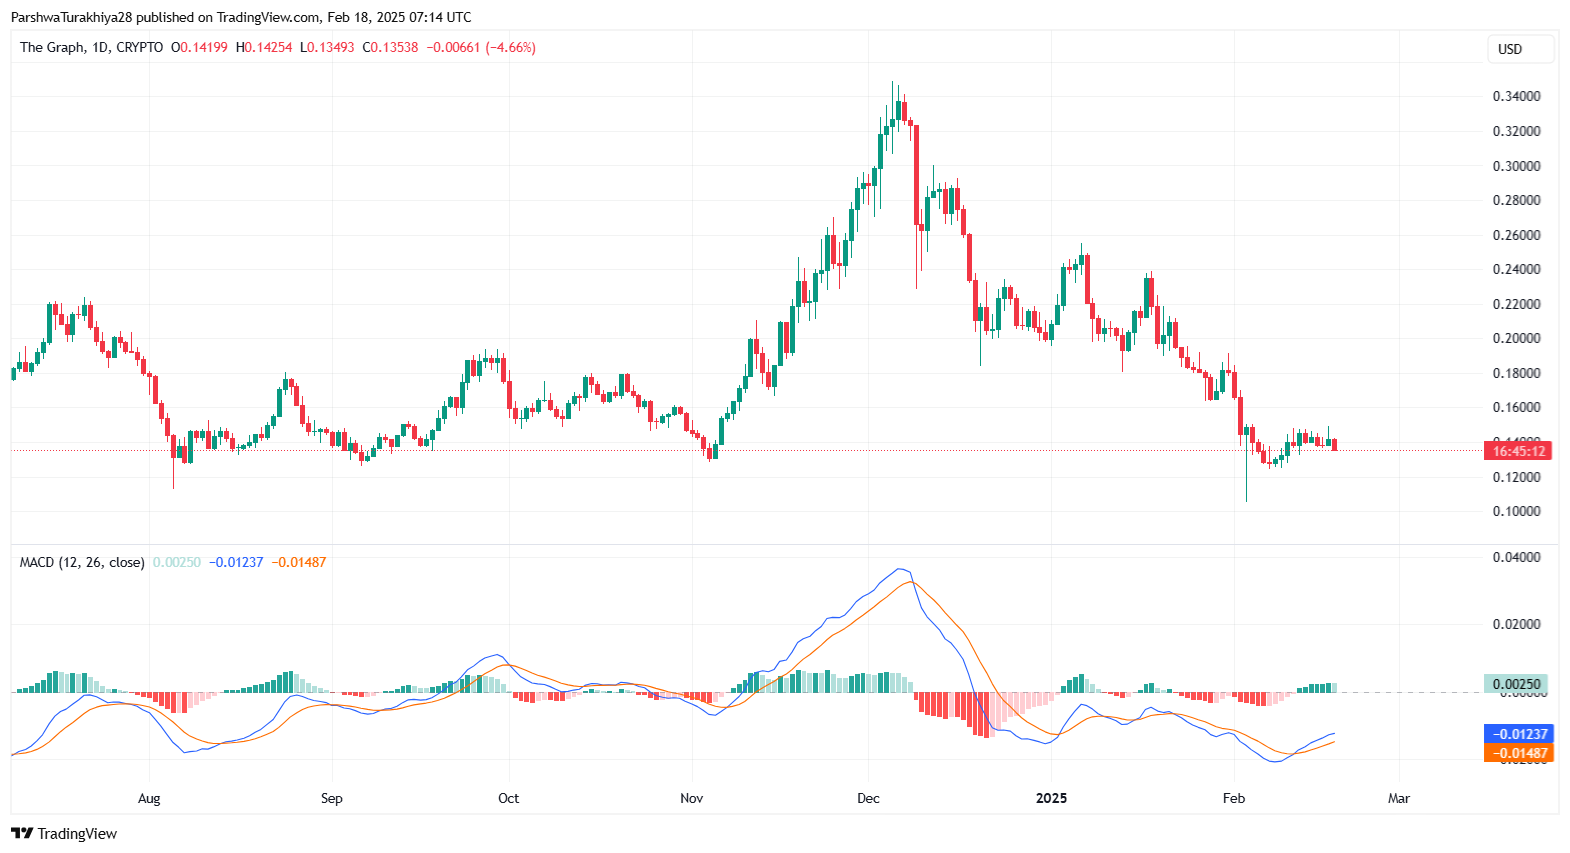
The MACD analysis for The Graph (GRT) on the daily timeframe suggests a potential shift in momentum. The MACD line is currently at 0.00249, while the signal line stands at -0.01239, confirming a recent bullish crossover. The histogram is showing positive green bars, indicating that buying pressure is slowly increasing. However, the MACD is still in negative territory, suggesting that the broader trend remains bearish.
For GRT to establish a stGRTUSDger recovery, the MACD line must continue diverging above the signal line, confirming sustained upward momentum. Resistance near $0.16 remains a key level, where previous rallies have faced rejection. If the MACD starts to flatten or converge downward, it may indicate weakening buying strength, leading to potential consolidation or another downward move. Traders should monitor whether the histogram continues to expand positively, as this would validate a short-term bullish trend.
Relative Strength Index (RSI) Analysis for The Graph (GRT)
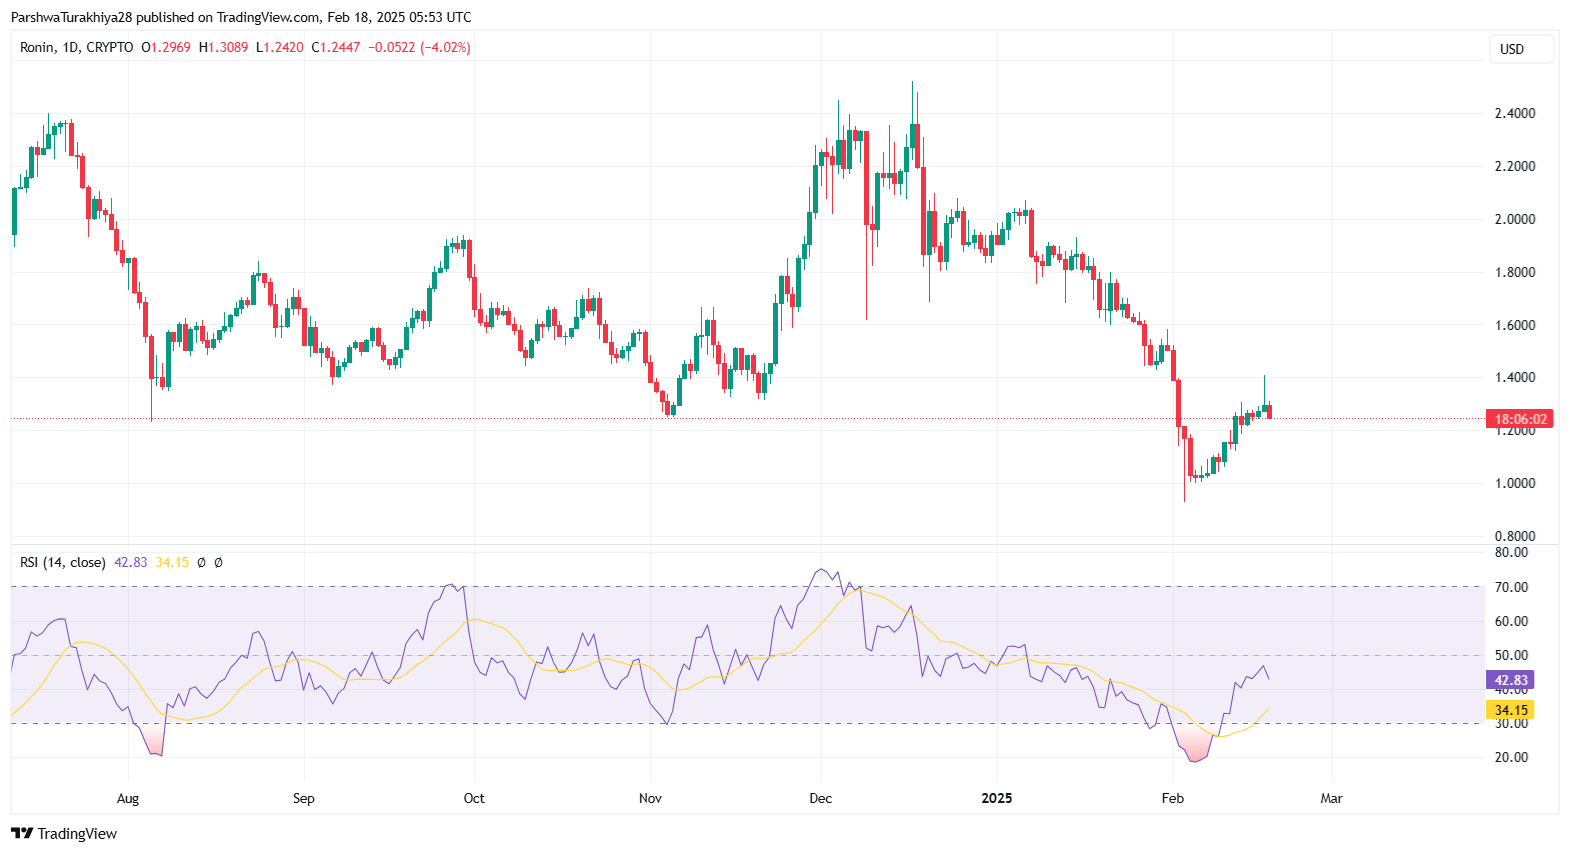
The Relative Strength Index (RSI) analysis for The Graph (GRT) on the daily chart indicates a cautious recovery from oversold conditions. The RSI is currently at 37.50, having rebounded from recent lows near 30, which previously signaled an oversold state. While the upward movement suggests an attempt to regain bullish momentum, the RSI remains below the neutral 50 level, indicating that sellers still hold control.
For a bullish confirmation, GRT needs to push the RSI above 50, which would indicate growing buying strength and a potential move toward key resistance levels around $0.16 to $0.18. However, if the RSI fails to sustain its upward trajectory and drops below 35, it could signal renewed selling pressure, leading to another test of support near $0.12. Traders should monitor whether the RSI continues to rise steadily, as a breakout above 50-55 would suggest stGRTUSDger bullish momentum, while a decline below 30 may indicate further downside risk.
Support and resistance levels for The Graph (GRT)
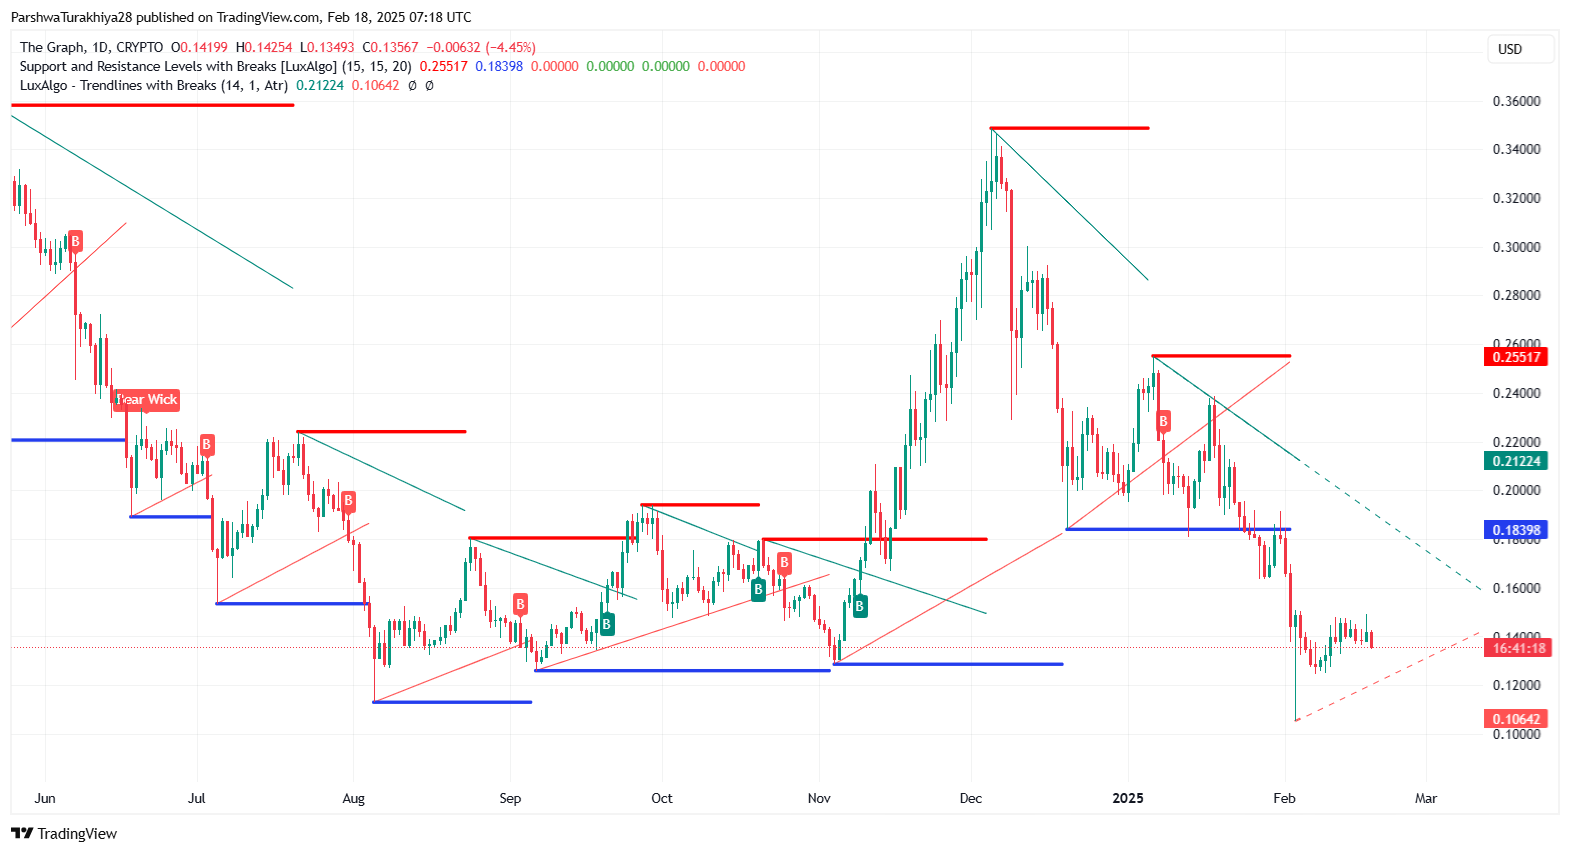
The support and resistance analysis for The Graph (GRT) on the daily chart highlights key price levels influencing market movements. The immediate support level is positioned at $0.10642, aligning with a previous accumulation zone where buyers have historically stepped in. If GRT breaks below this level, the next critical support is at $0.1000, a psychological threshold that could determine further price action. A deeper decline might lead to a test of the $0.0800 range, a historically significant floor where demand previously surged.
On the resistance side, the nearest hurdle is at $0.18398, aligning with prior rejection points and a descending trendline. A decisive breakout above this level could pave the way for an attempt to reclaim the next resistance at $0.21224, which represents a stGRTUSDg barrier where sellers have previously entered the market. Beyond this, the major resistance level stands at $0.25517, a critical level that could signal a trend reversal if breached.
The price action remains within a descending trendline, and the presence of multiple bear wicks suggests caution, as selling pressure is still evident at higher levels. A sustained move above $0.18 could indicate a bullish reversal, while failure to hold $0.13 may result in a deeper correction. Traders should watch for volume confirmation and trendline breaks to assess the potential for continuation or reversal of the current price trend.
The Graph (GRT) 2025 Price Prediction Analysis

Based on technical analysis and key support and resistance levels, The Graph (GRT) is projected to trade between $0.60 and $1.05 in 2025, with an average expected price of $0.85.
Support and Resistance Levels
- Key Support Levels: $0.10642, $0.14000, $0.14771
- Key Resistance Levels: $0.17270, $0.18865, $0.19642, $0.21224
Currently, GRT is trading near $0.13582, struggling to break above immediate resistance at $0.14 – $0.15. The trend remains bearish, but if buying momentum picks up, the first major target would be $0.18 – $0.20, aligning with the 200-day EMA at $0.19642.
Bullish Case:
If GRT can sustain a move above $0.20, it could trigger a stGRTUSDger breakout towards $0.25 – $0.30 in mid-2025, with a potential high of $1.05 by year-end if market sentiment remains stGRTUSDg.
Bearish Case:
Failure to hold above $0.12 – $0.14 could see GRT retesting lower support at $0.10, with a worst-case scenario revisiting $0.06, particularly if broader market conditions turn bearish.
The Graph (GRT) Price Prediction for 2026
GRT is expected to trade between $1.05 and $1.82, with an average price of $1.30. Growing adoption of decentralized indexing services and increased network usage could drive demand. If the market sustains bullish momentum, GRT may break the $1.80 resistance, reinforcing a long-term uptrend.
The Graph (GRT) Price Prediction for 2027
With a projected range of $1.62 to $2.20, GRT’s ecosystem expansion and integration with major blockchain networks could fuel steady growth. Institutional participation and improved staking incentives may push the price beyond $2.00, solidifying its position in the Web3 infrastructure.
The Graph (GRT) Price Prediction for 2028
With a projected price range of $10.39 to $12.99, GRTUSDin is anticipated to establish itself as a leading blockchain for gaming. Institutional adoption and increased transaction volumes could contribute to steady appreciation. A breach of $13.00 would indicate sustained bullish momentum.
The Graph (GRT) Price Prediction for 2029
Trading between $2.35 and $3.30, GRT could benefit from mass adoption in enterprise-level blockchain applications. If data indexing and querying solutions become integral to Web3 development, The Graph’s value proposition could see substantial institutional investment, pushing GRT closer to the $3.30 target.
The Graph (GRT) Price Prediction for 2030
With a price range of $3.15 to $3.65, GRT is expected to establish itself as a cornerstone of decentralized infrastructure. Enhanced scalability, new integrations, and global adoption of Web3 technology could drive the token to new highs. A break above $3.50 could position GRT for sustained long-term growth.
FAQs
The Graph is a decentralized indexing protocol that enables efficient querying of blockchain data, making it easier for developers to build decentralized applications (dApps).
Unlike centralized data providers, The Graph uses subgraphs to index blockchain data in a decentralized, secure, and scalable manner.
GRT is expected to trade between $0.60 and $1.05, with an average price of $0.85, depending on market trends and adoption rates.
GRT could reach $3.65 by 2030 if blockchain data indexing becomes a critical infrastructure for Web3 applications.
Major resistance levels for GRT in 2025 include $0.18, $0.21, and $0.25, with a breakout above these levels signaling bullish momentum.
Increasing blockchain adoption, rising demand for decentralized data indexing, and partnerships with Web3 projects could drive GRT’s price growth.
GRT’s strong use case in Web3 infrastructure suggests long-term potential, especially if decentralized indexing continues gaining traction.
Market volatility, competition from other blockchain data solutions, and regulatory concerns could impact GRT’s long-term performance.
GRT holders can delegate tokens to indexers and earn rewards while securing the network’s data indexing operations.
While GRT has the potential to surpass its all-time high, it will depend on adoption, market conditions, and broader cryptocurrency trends.
Disclaimer: The information presented in this article is for informational and educational purposes only. The article does not constitute financial advice or advice of any kind. Coin Edition is not responsible for any losses incurred as a result of the utilization of content, products, or services mentioned. Readers are advised to exercise caution before taking any action related to the company.


