


- The collective market cap for the cryptocurrency market rose 0.04% over the past 24 hours.
- ADA, SOL, DOGE, DOT and LUNC were all trading at critical points on their daily charts.
- Noteworthy technical flags were on the verge of being triggered on ADA and DOT’s daily charts.
The global cryptocurrency market cap printed a 24-hour gain of 0.04% according to CoinMarketCap. Subsequently, the total stood at approximately $1.19 trillion at press time. As the month comes to an end, investors and traders are looking for altcoins that show the most potential for gains this August.
At press time, significant medium-term technical flags were on the verge of being triggered for several altcoins, including Cardano (ADA), Solana (SOL), Polkadot (DOT), Terra Classic (LUNC) and Dogecoin (DOGE). Should the technical flags present on these cryptocurrencies’ charts trigger, it may lead to substantial gains for traders and investors.
Cardano (ADA)
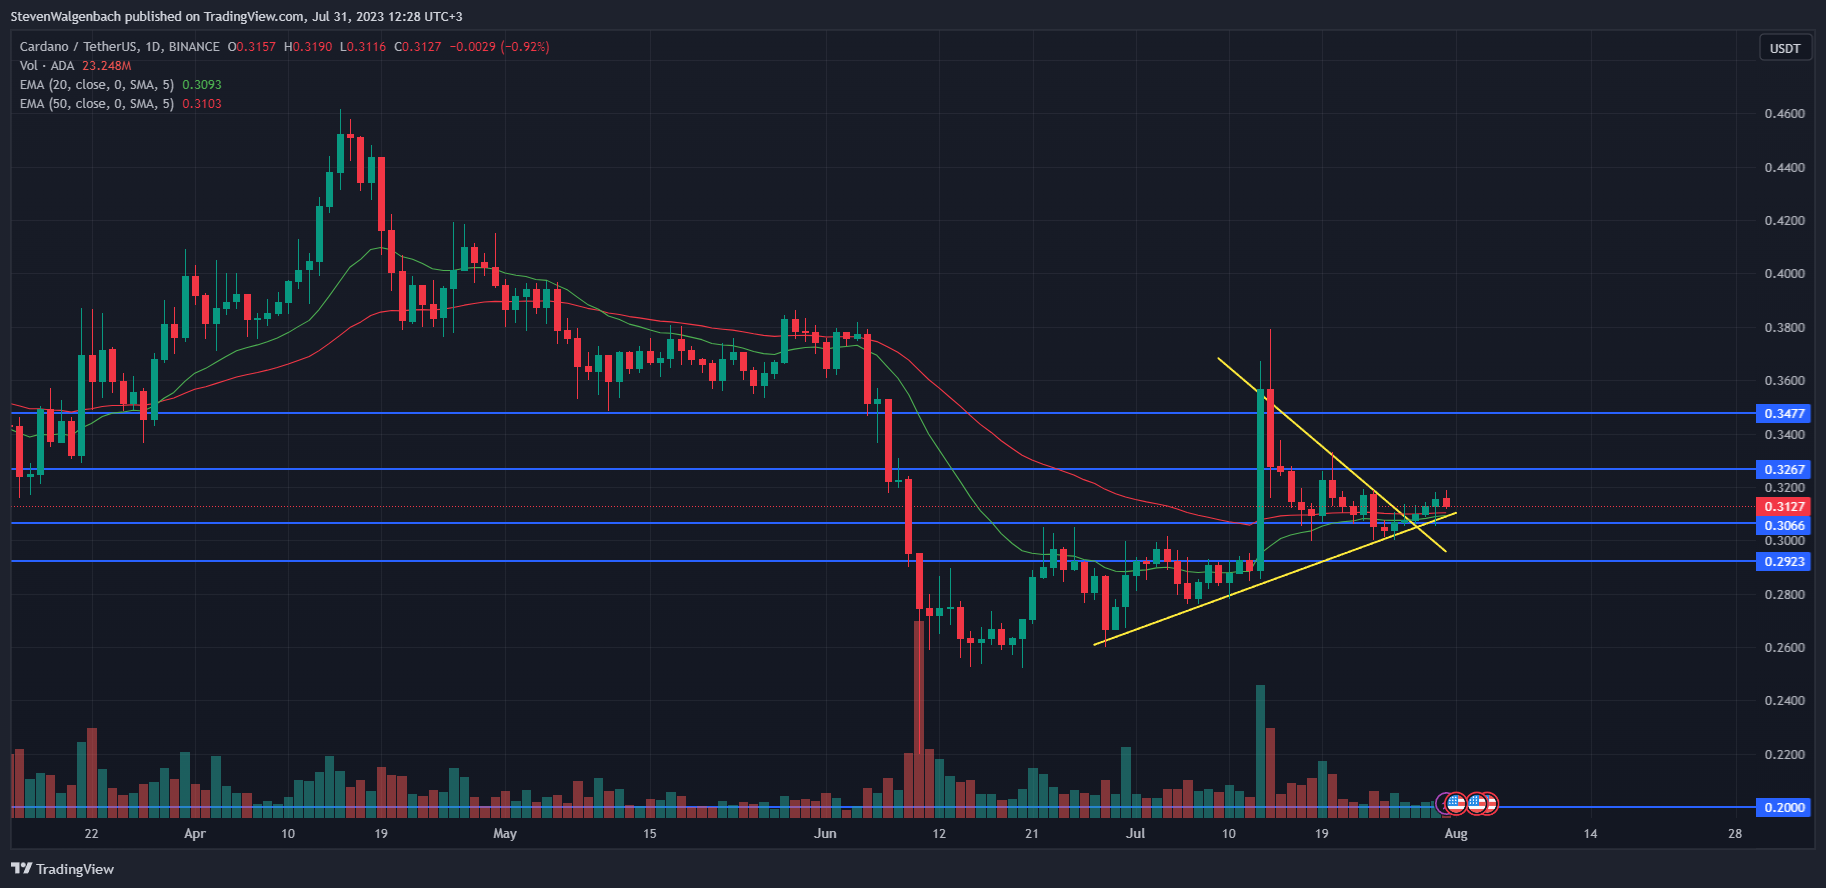
A symmetrical triangle pattern had formed on ADA’s daily chart over the past few weeks. This pattern signals that a potential breakout may occur as soon as its apex is reached. In the last 5 days, ADA’s price had broken out above this pattern. Therefore, it is fair to speculate that the altcoin’s price may surge in the coming few weeks.
The cryptocurrency’s price was able to break above the resistance level at $0.3066 over the past week, ultimately flipping the level into support. Should the bullish thesis be validated, ADA’s price may flip the next resistance level at $0.3267 in the coming week. Continued buy pressure could also elevate it to $0.3477 as well.
On the other hand, if ADA’s price closes a daily candle below $0.3066 in the next 48 hours, then it may be at risk of dropping to $0.2923 in the following couple of weeks. The bullish thesis is more likely to play out, as a significant bullish technical flag was on the verge of being triggered.
At press time, the 20-day EMA line was looking to cross above the 50-day EMA line. Should these two technical indicators cross, it will signal that ADA has entered into a medium-term bullish cycle and its price may rise in the next few weeks.
Solana (SOL)
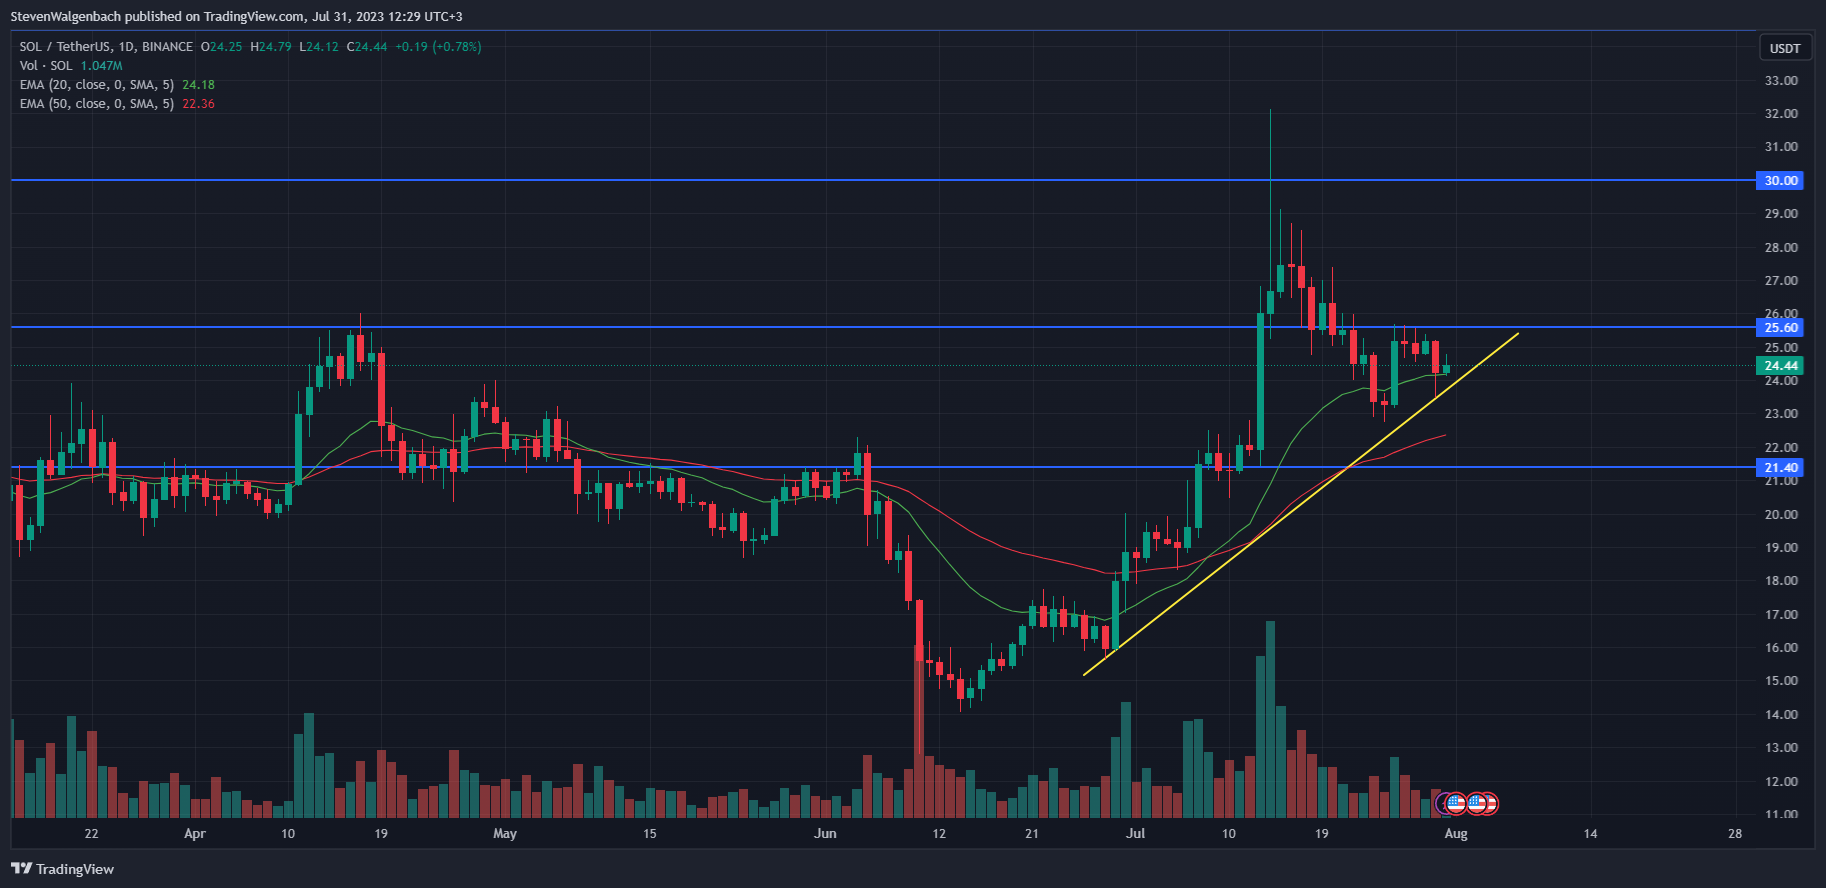
SOL had dropped below the crucial support level at $25.60 over the past week, and continued to trade below the mark at press time. Furthermore, sell pressure at press time forced the altcoin’s price to rest on the 20-day EMA line as well. Should it break below this technical indicator, then it may be at risk of falling to $21.40 in the next week.
On the other hand, if SOL is able to close the next 2 daily candles above the 20-day EMA line at $24.18 then the bearish thesis may be invalidated. In this scenario, SOL’s price could look to reclaim the $25.60 support in the following few days. A break above this level will then clear a path for SOL to rise to $30 in the next few weeks.
Investors and traders will want to keep an eye on the 20-day and 50-day EMA lines for the next 2 weeks. At press time, the 20-day EMA line was positioned bullishly above the 50-day EMA line. However, if the gap that exists between the two lines begins to decrease, then it may result in a bearish cross in the upcoming weeks.
Should this cross happen, it will indicate that SOL has entered into a medium-term bearish trend and its price may fall. An early indication that this could happen will be if SOL’s price breaks below the positive trend line that had formed on its daily chart over the past month.
Polkadot (DOT)
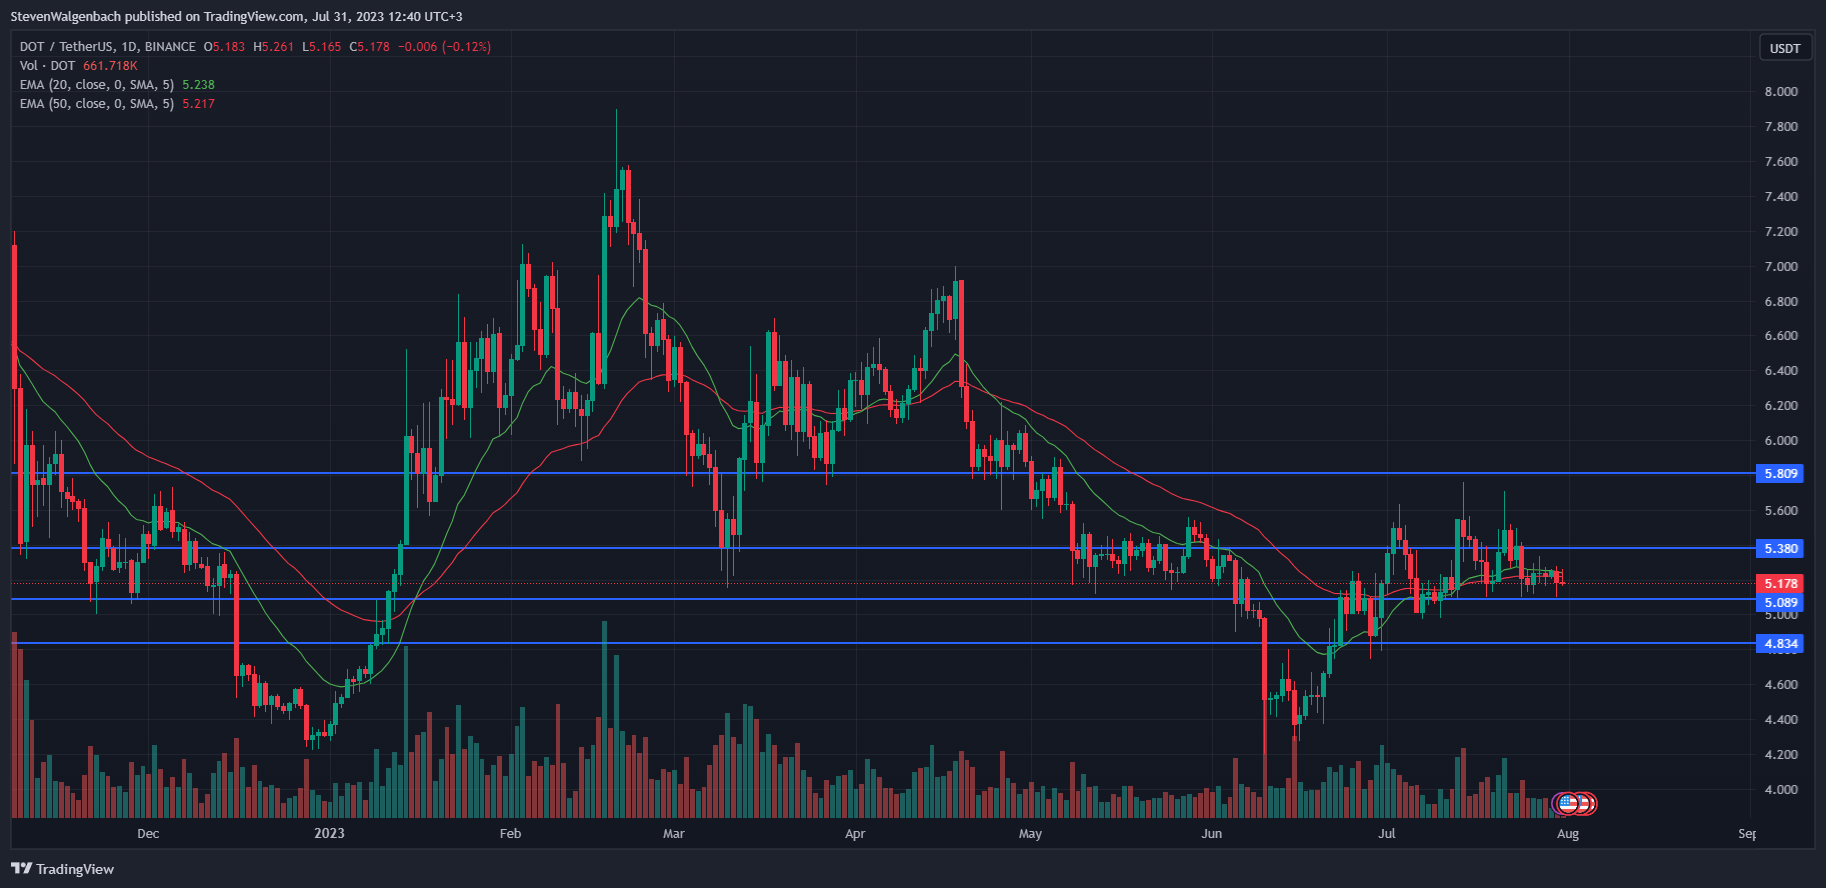
A major bearish technical flag was on the verge of being triggered on DOT’s daily chart, as the 20-day EMA line was on the cusp of breaking below the 50-day EMA line. If this bearish cross between the two technical indicators takes place, then the altcoin’s price may be at risk of breaching the crucial support level at $5.089 in the next 24-48 hours.
A break below this support will put the cryptocurrency at risk of falling to $4.834 in the following week. Conversely, if DOT is able to close a daily candle above the 20-day and 50-day EMA lines at around $5.238, then the bearish thesis will be invalidated. This may then result in the altcoin’s price climbing to as high as $5.809 in the next few weeks.
Terra Classic (LUNC)
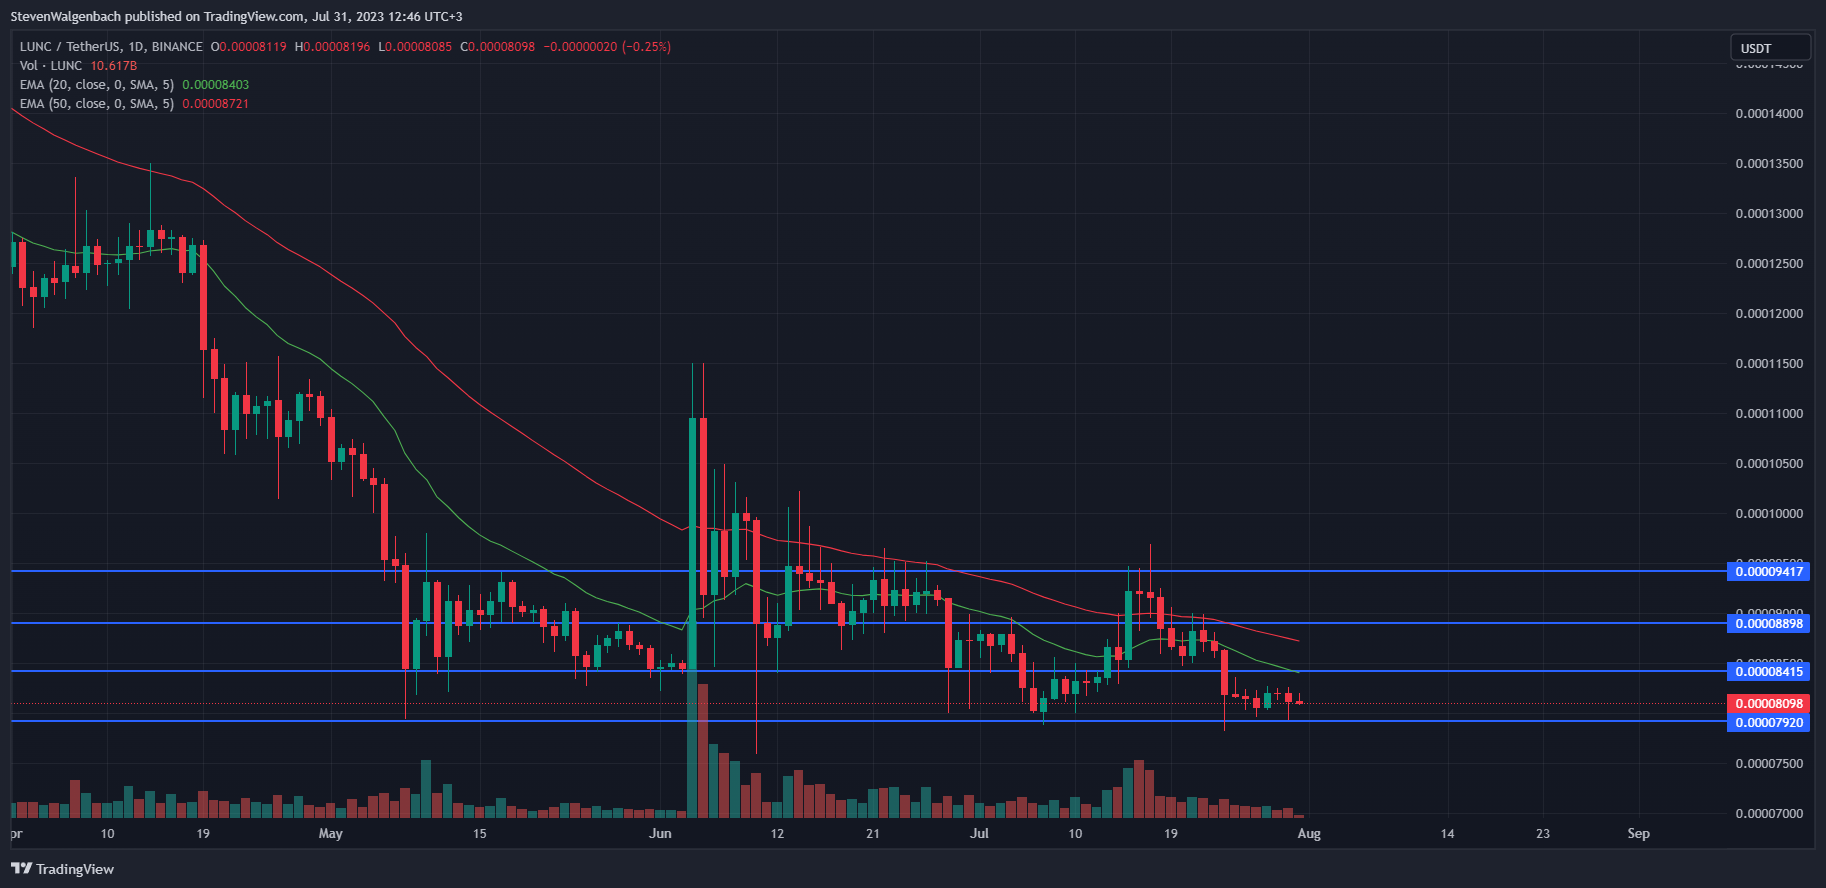
LUNC was at risk of dropping below the $0.00007920 support at press time, which may open the door for it to plummet to a new all-time low since its relaunch. On the other hand, if it is able to close a daily candle above $0.00008415, then it will have the support of the 20-day EMA line, which will clear a path for it to rise to the 50-day EMA line at $0.00008721.
A break above this technical indicator may give LUNC the momentum it needs to overcome the $0.00008898 resistance as well. This will then clear a path for it to continue to rise to $0.00009417 if bulls continue to drive the cryptocurrency’s price at this point.
Dogecoin (DOGE)
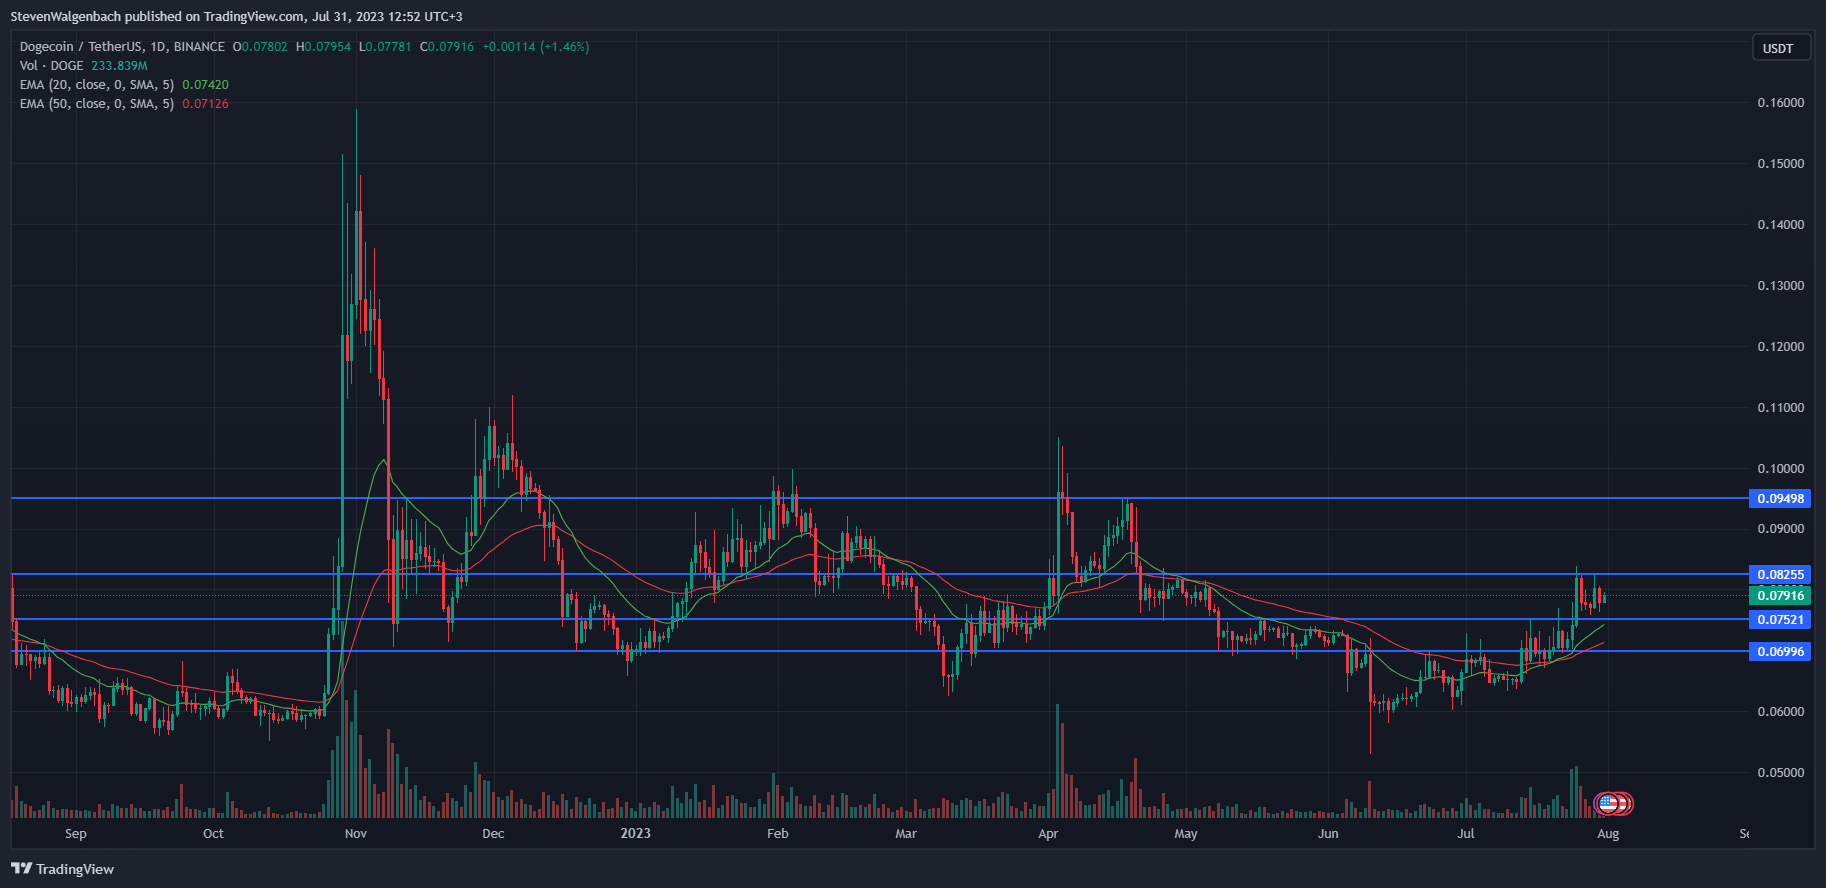
DOGE had been in a consolidation phase between $0.07521 and $0.08255 for the past week. It had attempted to break out above this channel on Saturday, but was unable to do so. Should the altcoin succeed in breaking above $0.08255 in the next 48 hours, then it will most likely continue to climb to $0.09498 in the following week.
On the other hand, a break below the support at $0.07521 will put DOGE’s price at risk of falling to $0.06996 in the next few days. Momentum was in favor of bulls, however, as the 20-day EMA line was positioned above the 50-day EMA line. This suggested that DOGE was in a medium-term positive trend and its price may rise in the next few weeks.
Disclaimer: The views and opinions, as well as all the information shared in this price analysis, are published in good faith. Readers must do their own research and due diligence. Any action taken by the reader is strictly at their own risk. Coin Edition and its affiliates will not be held liable for any direct or indirect damage or loss.
Disclaimer: The information presented in this article is for informational and educational purposes only. The article does not constitute financial advice or advice of any kind. Coin Edition is not responsible for any losses incurred as a result of the utilization of content, products, or services mentioned. Readers are advised to exercise caution before taking any action related to the company.


