
- Theta Network’s price drops 21.82% in 24 hours amid partnership announcement.
- Support levels at $1.30 and $1.00 could determine Theta’s near-term price.
- RSI suggests potential bounce, but MACD indicates continued bearish momentum.
Theta Network (THETA) recently saw a significant drop in its price following a new partnership announcement. Theta Labs revealed on January 31 that it had partnered with DeepSeek, a Chinese AI startup. This partnership is set to integrate Theta’s EdgeCloud with DeepSeek’s R1 AI model. The collaboration aims to improve cost efficiency, reduce latency, and enhance scalability.
Additionally, it seeks to provide the necessary infrastructure to meet the growing demands of AI processing. Despite this promising development, Theta’s price has taken a sharp downturn in the past few days, raising questions about the broader market sentiment and investor behavior.
THETA’s Price Action and Market Cap
THETA’s current price stands at $1.37, marking a notable -21.82% decline in the past 24 hours and a -23.85% drop over the last week. The 24-hour trading volume of $98 million indicates active market participation, yet the price action remains predominantly negative.
With a circulating supply of 1 billion THETA, the total market capitalization of the token is approximately $1.36 billion. This latest price drop is attributed to a combination of technical factors, investor sentiment, and the broader market conditions affecting the cryptocurrency space.
Related: Theta Network Price Prediction 2024-2030: Will THETA Price Hit $5 Soon?
Key Support and Resistance Levels
The current downtrend, which has seen a 11.26% decrease, highlights a significant breakdown below key support levels. The next immediate support zone is located at $1.30, a psychologically important level that may attract buyers looking to stabilize the price. However, if this level fails to hold, the next substantial floor lies at $1.00, a historical support area that could provide a stronger foundation for a potential reversal.
On the other hand, resistance levels are becoming more apparent. First, $1.50 serves as the initial resistance zone, as this price point aligns with the recent breakdown. A further upward move might encounter resistance at $1.75, a level that was tested during the last consolidation phase. These resistance zones will be key in determining whether the price can recover from its recent losses.
What Do the Technical Indicators Say?
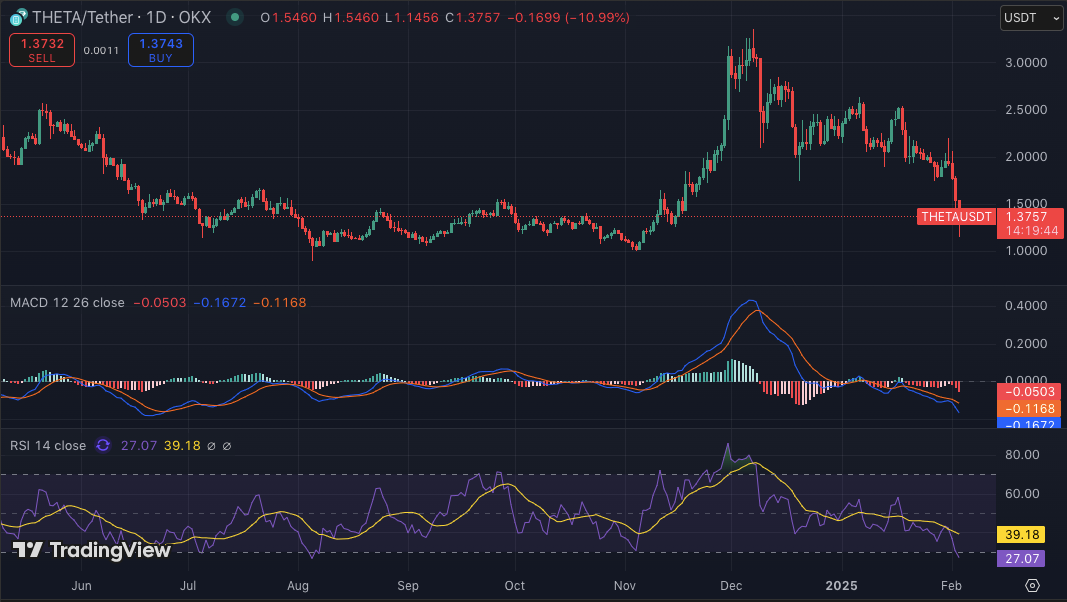
The technical indicators for THETA further confirm the prevailing bearish sentiment. The Relative Strength Index (RSI) currently stands at 26.99, putting the token in oversold territory. This suggests the potential for a short-term price bounce as the asset could be due for a correction.
Related: XRP Climbs to Third Rank as Altcoins ALGO, SOL, THETA Surge
However, the Moving Average Convergence Divergence (MACD) presents a clearer bearish outlook. Both the MACD line and the signal line remain below zero, indicating a continuation of the downtrend in the near future.
Disclaimer: The information presented in this article is for informational and educational purposes only. The article does not constitute financial advice or advice of any kind. Coin Edition is not responsible for any losses incurred as a result of the utilization of content, products, or services mentioned. Readers are advised to exercise caution before taking any action related to the company.


