
- Price analysis for Theta Network reveals a bearish trend.
- Additionally, technical indicators also foresee the persistence of the bearish run.
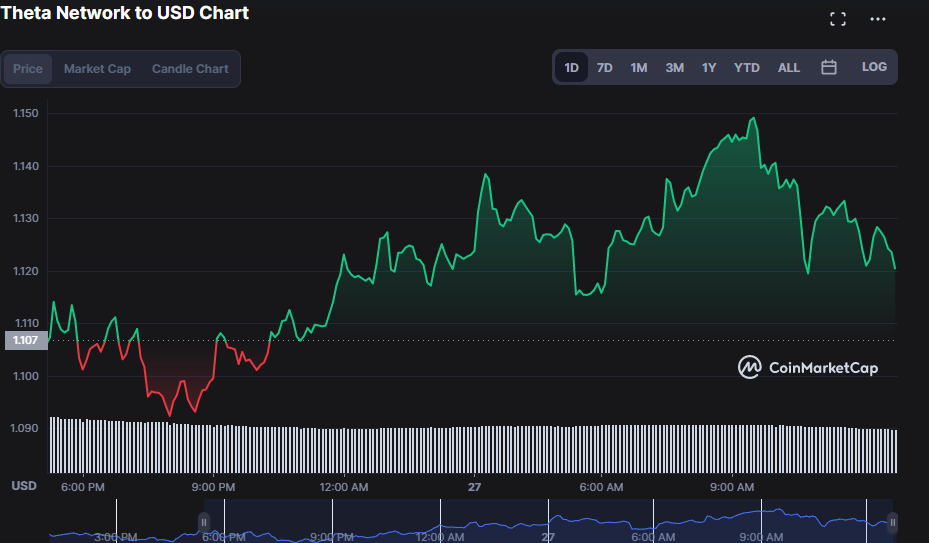
- THETA’s price has decreased by 0.17% to $1.10 in the last few hours.
According to Theta Network price research, the THETA market will continue to see bearish momentum because bears are in charge, with prices falling up to $1.10, a decrease of 0.25% as of press time.
In the last 24 hours, the 1-day trading volume has declined by 31.51% to $38,667,616 while the market capitalization has climbed by 1.49% to $1,100,848,897.
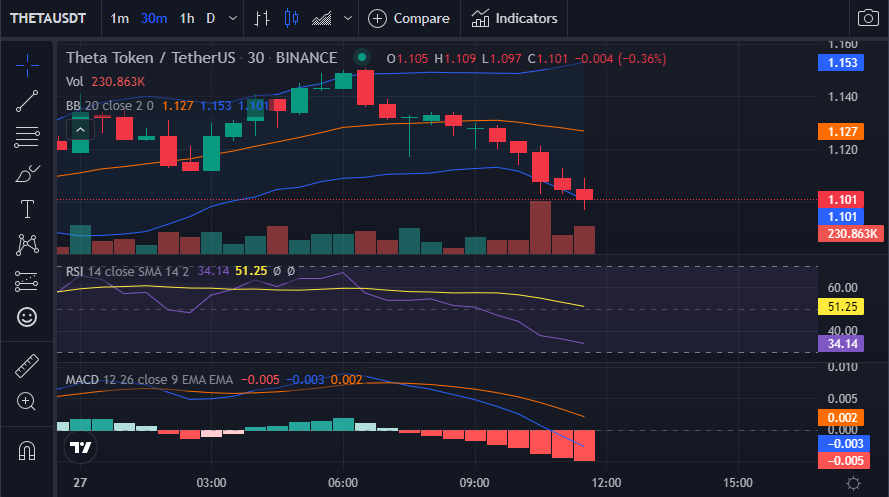
With a reading of -0.003 and trending south, the MACD is moving in the negative area, which is a bearish indicator. Additionally, the blue MACD line crosses below the signal line and the histogram has a reading of -0.005, which is also in the negative range, indicating that the market’s bearish momentum will continue.
The Bollinger Bands’ rising divergence points to increased selling activity. Both the top and bottom bands contact at 1.153 and 1.101 respectively. The market is moving downward as it approaches the bottom band, reinforcing the gloomy feeling and signaling that the decline may persist.
The RSI (Relative Strength Index), which compares gains to losses and is oriented south, is showing a negative trend at 41.63. Because the RSI is moving toward the oversold region, the THETA price chart predicts that the market’s bearish trend will intensify.
The 5-day MA crosses below the 20-day MA, signaling a bearish crossing on the 1-day price chart. While the 20-day MA is at 1.020, the 5-day MA is at 1.019. The market is below both MAs, signaling a negative momentum, and bolstering this bearish outlook.
With a value of -0.00, the Stoch RSI is in the oversold area. This serves as a warning to investors that the prices may turn up, however, this is not definite.
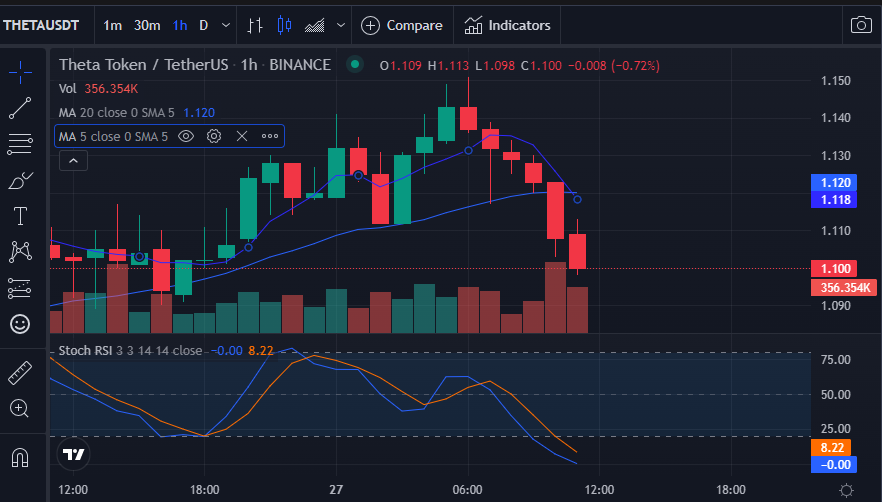
The bulls must maintain their position at the resistance level in order to drive prices higher. There will likely be buying pressure at the $1.09 support level, which could result in a rise in prices.
Disclaimer: The views and opinions, as well as all the information shared in this price analysis, are published in good faith. Readers must do their own research and due diligence. Any action taken by the reader is strictly at their own risk, Coin Edition and its affiliates will not be held liable for any direct or indirect damage or loss.
Disclaimer: The information presented in this article is for informational and educational purposes only. The article does not constitute financial advice or advice of any kind. Coin Edition is not responsible for any losses incurred as a result of the utilization of content, products, or services mentioned. Readers are advised to exercise caution before taking any action related to the company.


