


 Price Prediction: Will TPY Reach $10 Soon?")
- Bullish TPY’s price prediction ranges from $2.012 to $3.910 in 2023.
- TPY price might also reach $12.56 in 2024.
- TPY’s bearish market price prediction for 2024 is $5.382 to $6.136.
As the crypto community continues to demand decentralization and DeFi, various projects have started to provide efficient solutions to meet the community’s interests. Thrupenny Protocol, a new DeFi ecosystem, plans to embrace the power of blockchain to offer a “smart investment system” for its users.
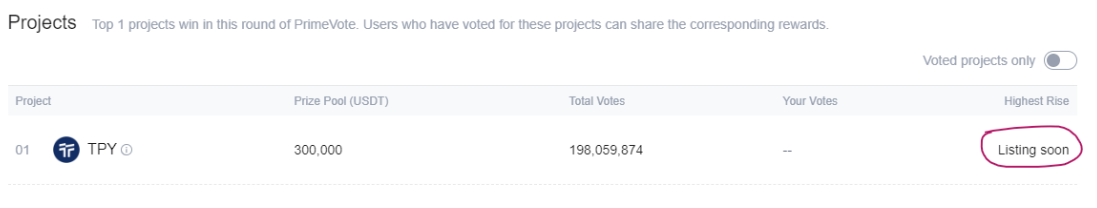
During a recent competition, TPY was dubbed the “HTX PrimeVote #9 Champion” after it received 198,059,874 total rocket votes from the community. There may be a chance that once TPY gets listed on HTX, several traders will jump on the chance to purchase the tokens, triggering a bullish spike caused by the overbuying activity.
TPY, the native token of the Thrupenny Protocol, can be utilized for various purposes within the platform, such as lending and borrowing, staking and yield farming, governance, and more. As Thrupenny continues its mission to revolutionize the DeFi, there is a high chance that TPY’s price could be affected as time passes.
Before we analyze and forecast TPY’s price for 2023, 2024, and 2025 up to 2050, let’s first understand Thrupenny’s operations and how the platform hopes to achieve its mission of providing a “cutting-edge decentralized financial infrastructure.”
Table of contents
- What is Thrupenny (TPY)?
- Thrupenny (TPY) Current Market Status
- Thrupenny (TPY) Price Analysis 2023
- Thrupenny (TPY) Price Prediction 2023-2050 Overview
- Thrupenny (TPY) Price Prediction 2023
- Thrupenny (TPY) Price Prediction 2024
- Thrupenny (TPY) Price Prediction 2025
- Thrupenny (TPY) Price Prediction 2026
- Thrupenny (TPY) Price Prediction 2027
- Thrupenny (TPY) Price Prediction 2028
- Thrupenny (TPY) Price Prediction 2029
- Thrupenny (TPY) Price Prediction 2030
- Thrupenny (TPY) Price Prediction 2040
- Thrupenny (TPY) Price Prediction 2050
- Conclusion
- FAQ
What is Thrupenny (TPY)?
Described as the “new DeFi ecosystem with a smart investment system,” Thrupenny has its own in-built Derivatives Decentralized Exchange and offers many DeFi solutions for the crypto community. One of the main goals of the Thrupenny Protocol is to revolutionize the DeFi sector by developing a decentralized financial infrastructure that offers transparency, accessibility, and trustlessness.
Moreover, there are many solutions that Thrupenny Protocol contributes to the DeF sector such as Flash Loan Arbitage, Yield Farming, Fixed Interest Rates, Mitigate Overcollaterization, and Active Risk Management. Apart from these solutions, the Thrupenny Protocol also integrated the Arbitrage bot automation system, asset management system, Thrupenny DEX, smart interest rate system, and more.
The native token of the Thrupenny Protocol, TPY, has many utilities that could be used across its ecosystem. TPY can be used as collateral for the Thrupenny lending and borrowing platform. Moreover, users can earn rewards when they deposit and stake TPY in the platform’s staking pools. Users can also earn rewards when they participate in the yield farming pools. Finally, TPY holders can submit proposals and partake in voting as part of Thrupenny’s governance system.
Furthermore, TPY allows users access to Thrupenny’s premium features, such as higher lending and borrowing limits, community incentives and rewards, and increased reputation and trust within the Thrupenny community. TPY holders also gain exclusive access to products and services, as well as exclusive access to its premium features within its platform.
Thrupenny (TPY) Current Market Status
At the time of writing, TPY is now trading at $0.684 with a total market capitalization of $114,040,347. Moreover, there has been a spike of 4.26% in the past 24 hours. TPY’s 24-hour trading volume is $1,800,418 after it witnessed a 42.90% spike.
Some of the crypto exchanges for trading TPY are currently XT.COM, LBank, and MEXC.
Now, let’s dive further and discuss the price analysis of TPY for 2023.
Thrupenny (TPY) Price Analysis 2023
As Thrupenny aims to revolutionize the DeFi sector, will TPY catch the attention of potential investors and users? Moreover, would the changes in the DeFi sector affect TPY’s price over time? Read more to find out about TPY’s 2023 price analysis.
Thrupenny (TPY) Price Analysis 2023 – Bollinger Bands
The Bollinger Bands are a technical analysis tool that is used to analyze price movement and volatility. Bollinger Bands (BB) utilize the time period and the standard deviation of the price. Normally, the default value of BB’s period is set at 20. The Bollinger Bands consist of upper and lower bands that can be used together, along with the middle line (simple moving average), to determine whether the price will rise or fall.
The upper band of the BB is calculated by adding 2 times the standard deviations to the middle line, while the lower band is calculated by subtracting 2 times the standard deviation from the middle line. Based on the empirical law of standard deviation, 95% of the data sets will fall within the two standard deviations of the mean. As such, the prices of the cryptocurrency, when the Bollinger bands are applied, should stay within the upper and lower bands 95% of the time.
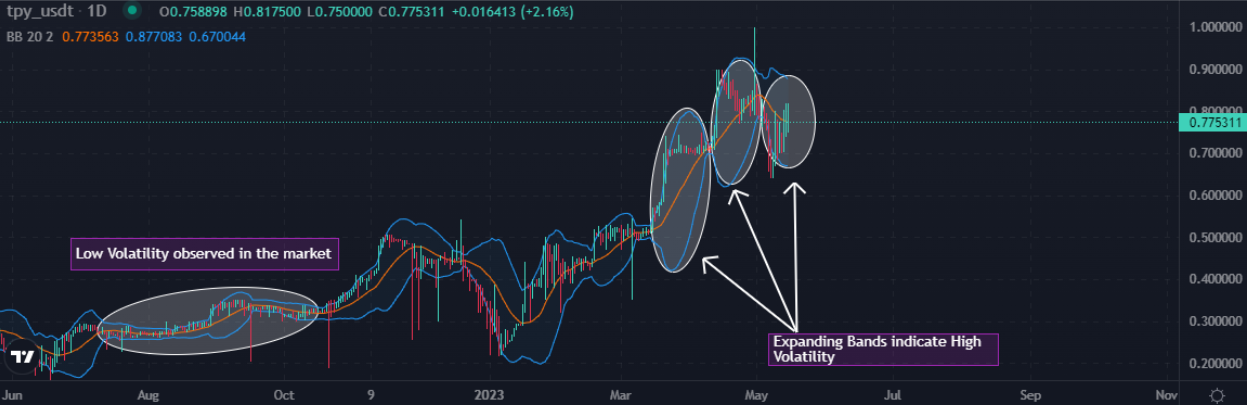
Recently, Bollinger Bands has expanded twice after TPY experienced high volatility in the market. TPY continued to stay in the upper band of the Bollinger band, which is considered an uptrend, during the first sign of high volatility in the market. The second expansion of the Bollinger Bands triggered TPY’s fall into the bottom half, which is considered the downtrend region.
Observing the earlier patterns, TPY would often experience a short-term period of low volatility in its market after experiencing high volatility. Since TPY already experienced low volatility, TPY has started to witness high volatility as the bands are expanding. This could create an opportunity for TPY to jump back into the upper bands.
Moreover, TPY also reached the oversold region, which could be another confirmation that the altcoin could experience a trend reversal and reach the upper band. The current trajectory could lead TPY into the top half of the Bollinger Bands.
Thrupenny (TPY) Price Analysis – Moving Average Convergence Divergence (MACD)
The Moving Average Convergence Divergence (MACD) indicator can be used to identify potential price trends, momentums, and reversals in markets. MACD will make the reading of a moving average cross easier. The MACD indicator is calculated by subtracting the long-term EMA (Exponential Moving Average) indicator from the short-term EMA. Normally, the default values for the MACD are set at 12-day EMA, 26-day EMA, and 9-day EMA. Moreover, MACD is considered a lagging indicator as it cannot provide trade signals without any past price data.
Traders have reported that occasionally the moving average could create false signals about the price momentum; however, the MACD plays an important role as it can confirm the trends and identify potential reversals.
Furthermore, there are two methods through which traders can speculate on the price’s momentum: the crossover method and the histogram method. In the crossover method, when the MACD line crosses above the signal line, the trend could change from a downtrend to a long trend. However, if MACD crosses below the signal line, this could indicate the start of a downtrend.
In the histogram method, the bars above the signal line indicate an uptrend. Meanwhile, the histogram bars below the signal line indicate a bearish trend.
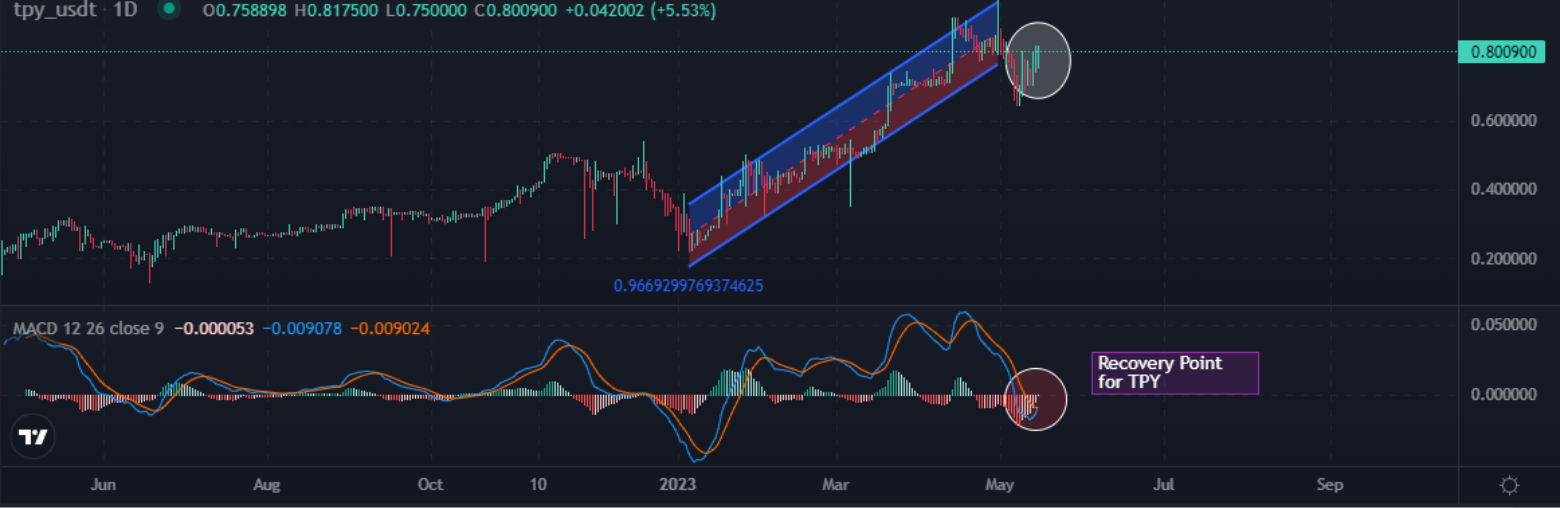
Looking at the MACD indicator, TPY has started to recover from its bearish fall. The MACD line is currently below the signal line, which is considered a bearish signal. However, the red bars have started to reduce, and the MACD line has traversed into the signal line’s path. There is a high possibility that the MACD line will be above the signal line, indicating that TPY’s bullish season will arrive soon. This cross between the MACD line and the signal line remains the recovery point for TPY.
Thrupenny (TPY) Price Analysis – Moving Averages
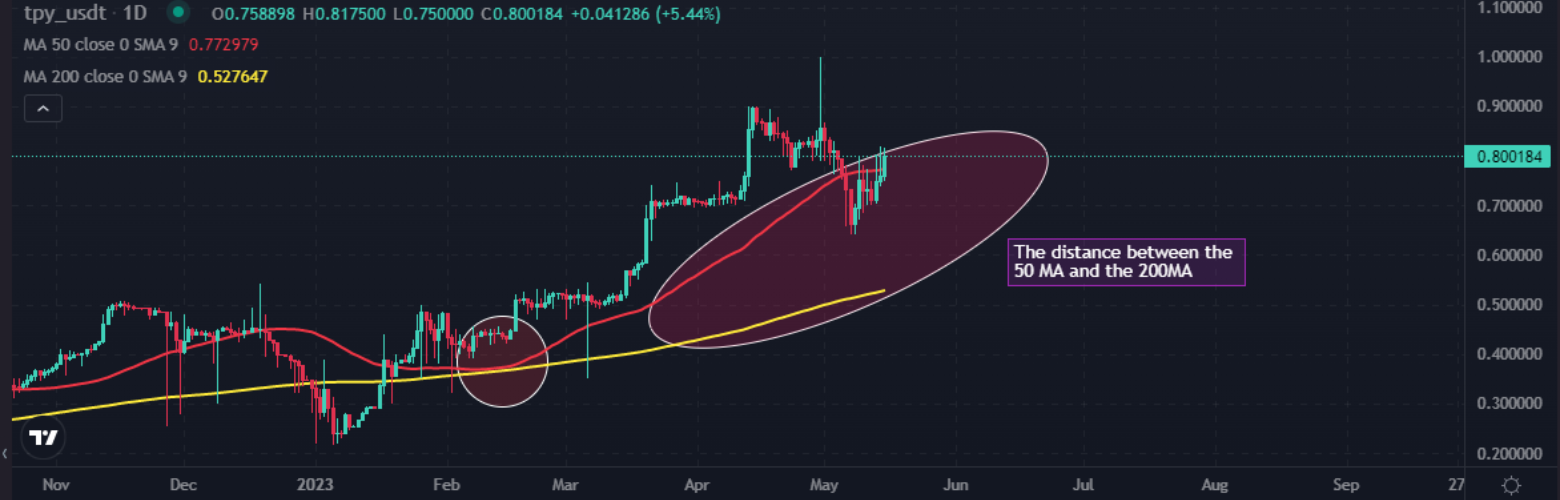
Looking at the charts, the candlesticks are currently trading above the 200MA and the 50MA. Traders often view this sentiment as a bullish sign, as the candlesticks could continue to go upwards.
Moreover, there is a huge gap between the 50MA and the 200MA, indicating that it would take some time before a death cross could happen. Moreover, the gap between the 200 MA and the 50 MA continues to expand, indicating that TPY may continue to experience bullish sentiment. Currently, TPY shows a positive sign as the candlestick is near the 50 MA, indicating that it may soon climb up and move toward its resistance.
Thrupenny (TPY) Price Prediction 2023-2050 Overview
| Year | Minimum Price | Average Price | Maximum Price |
| 2023 | $0.5507 | $0.8726 | $7.81 |
| 2024 | $5.382 | $10.006 | $12.56 |
| 2025 | $9.728 | $28.279 | $46.83 |
| 2026 | $22.471 | $24.323 | $28.469 |
| 2027 | $25.667 | $27.281 | $31.271 |
| 2028 | $27.203 | $30.044 | $36.818 |
| 2029 | $31.385 | $34.193 | $41.218 |
| 2030 | $36.398 | $41.181 | $47.164 |
| 2040 | $69.73 | $73.80 | $77.12 |
| 2050 | $85.271 | $92.152 | $99.012 |
Thrupenny (TPY) Price Prediction 2023
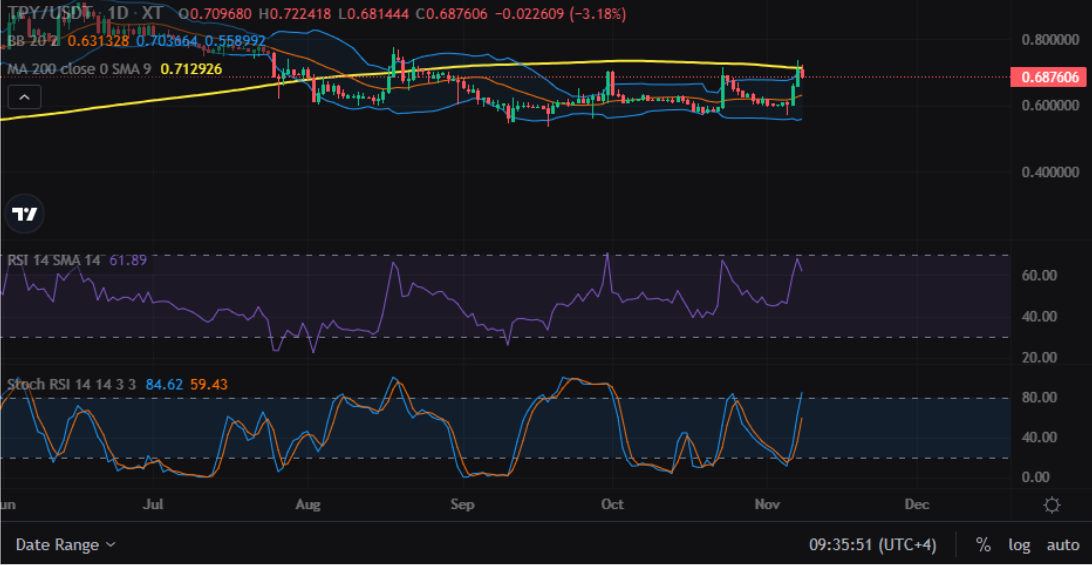
Looking at the TPY/USDT chart, it highlights that the altcoin was experiencing overbuying trading activity in the market as the RSI and stochastic RSI almost crossed the overbought barrier. The candlesticks are currently swinging inside the Bollinger Bands region and continue to test the upper band several times.
Moreover, the candlesticks’ wicks have recently crossed above the 200 MA, often seen as a bullish signal by several traders. With future developments and bullish signals, there may be a chance that TPY could cross several resistance levels in the final months of 2023.
Meanwhile, the forecast for TPY remains bullish and is expected to reach beyond the level of $3.91. If TPY experiences extremely bullish behavior, then it could even reach the $7.81 level.
| Bullish Price Prediction | Bearish Price Prediction |
| $2.012 – $3.910 | $0.4618 – $0.5507 |
Thrupenny (TPY) Price Prediction 2024
Traders are looking forward to this year as it could be a historic moment for cryptocurrencies, as the Bitcoin halving is expected to happen in 2024. Most of the time, whenever BTC rises, traders have observed a similar surge in the altcoins. TPY could also be affected by Bitcoin halving and could trade beyond the price of $12.56 by the end of 2024.
Thrupenny (TPY) Price Prediction 2025
TPY could still experience the after-effects of the Bitcoin halving and is expected to trade above its 2024 price. Many trade analysts speculate that BTC halving could create a huge impact on the crypto market. Moreover, similar to many altcoins, TPY would continue to rise in 2025, forming new resistance levels. It is expected that TPY would trade beyond the $31.83 level.
Thrupenny (TPY) Price Prediction 2026
It is expected that after a long period of bull runs, the bears will come into power and start negatively impacting cryptocurrencies. During this bearish sentiment, TPY could tumble into its support region of $22.47. Moreover, when TPY remains in the oversold region, there could be a price correction soon. TPY, by the end of 2026, could be trading beyond the $24.32 resistance level after experiencing the price correction.
Thrupenny (TPY) Price Prediction 2027
Naturally, traders expect bullish market sentiment after the crypto industry was negatively affected by the bears’ claw. TPY is expected to rise after its slumber in the bear season. Moreover, TPY could even break more resistance levels as it continues to recover from the bearish run. Therefore, TPY is expected to trade at $31.27 by the end of 2027.
Thrupenny (TPY) Price Prediction 2028
Once again, the crypto community is looking forward to this year, as there will be a Bitcoin halving. TPY will continue to form new higher highs and is expected to move on an upward trajectory. Hence, TPY would be trading at $36.81 after experiencing a massive surge by the end of 2028.
Thrupenny (TPY) Price Prediction 2029
2029 is expected to be another bull run due to the aftermath of the BTC halving. However, traders speculate that the crypto market will gradually become stable by this year. In tandem with the stable market sentiment and the slight price surge expected after the aftermath, TPY could be trading at $41.21 by the end of 2029.
Thrupenny (TPY) Price Prediction 2030
After witnessing a bullish run in the market, TPY and many altcoins would show signs of consolidation and might trade sideways for some time while experiencing minor spikes. Therefore, by the end of 2030, TPY could be trading at $47.16.
Thrupenny (TPY) Price Prediction 2040
The long-term forecast for TPY indicates that this altcoin could reach a new all-time high (ATH). This would be one of the key moments, as HODLERS may expect to sell some of their tokens at the ATH point. However, TPY may face a slight fall before starting its upward journey once again. It is expected that the price of TPY could reach $77.12 by 2040.
| Minimum Price | Average Price | Maximum Price |
| $69.73 | $73.80 | $77.12 |
Thrupenny (TPY) Price Prediction 2050
The community believes that there will be widespread adoption of cryptocurrencies, which could maintain gradual bullish gains. By the end of 2050, if the bullish momentum is maintained, TPY could surpass the resistance level of $89.012.
| Minimum Price | Average Price | Maximum Price |
| $85.271 | $92.152 | $99.012 |
Conclusion
To summarize, if investors continue to show interest in TPY and add these tokens to their portfolio, then it could continue to rise as time passes. TPY’s bullish price prediction shows that it could pass beyond the $3.910 level. Moreover, TPY could surpass the $99.012 level by the end of 2050.
FAQ
Described as the “new DeFi ecosystem with a smart investment system,” Thrupenny has its own in-built Derivatives Decentralized Exchange and offers many DeFi solutions for the crypto community. One of the main goals of the Thrupenny Protocol is to revolutionize the DeFi sector by developing a decentralized financial infrastructure that offers transparency, accessibility, and trustlessness.
TPY can be traded on many exchanges, such as XT.COM, LBank, and MEXC.
TPY has many features and focuses on revolutionizing the DeFi sector. This could increase demand from traders and potential investors, thus leading TPY to break through various resistance levels.
The maximum supply of TPY is 1,000,000,000.
TPY is expected to reach $3.910 in 2023.
TPY is expected to reach $12.56 in 2024.
TPY is expected to reach $46.83 in 2025.
TPY is expected to reach $28.46 in 2026.
TPY is expected to reach $31.27 in 2027.
TPY is expected to reach $36.81 in 2028.
TPY is expected to reach $41.21 in 2029.
TPY is expected to reach $47.16 in 2030.
TPY is expected to reach $77.12 in 2040.
TPY is expected to reach $99.012 in 2050.
Disclaimer: The information presented in this article is for informational and educational purposes only. The article does not constitute financial advice or advice of any kind. Coin Edition is not responsible for any losses incurred as a result of the utilization of content, products, or services mentioned. Readers are advised to exercise caution before taking any action related to the company.
 Price Prediction 2026-2030: Will TRX Hit $0.50 Soon?")
 Price Prediction 2026-2050: Will HYPE Hit $100 Soon?")


: What Happens If You Use an Unlicensed Platform?")