


- Bullish TOMO price prediction ranges from $0.200 to $3.600
- Analysis suggests that the TOMO price might reach above $3.5905
- The TOMO bearish market price prediction for 2023 is $0.2615
What is TomoChain (TOMO)?
TomoChain is a public EVM (Ethereum Virtual Machine)-compatible blockchain with low transaction fees, fast confirmation time, double validation, and randomization for security guarantees.
TOMO’s white paper proposes Proof-of-Stake Voting (PoSV) consensus, a Proof-of-Stake (PoS)-based blockchain protocol with a fair voting mechanism, rigorous security guarantees, and fast finality.
Furthermore, the TOMOchain whitepaper states: “We also present a novel reward mechanism and show that, with this mechanism, the blockchain has a low probability of forks, and fast confirmation times, plus the contributions and benefits of master nodes are fair in the sense that the probability distribution function is uniform eventually”
As such, the TomoChain network supports 2,000 TPS and 2s block time. Furthermore, it promises thousands of transactions for as little as less than $1. Moreover, the TomoChain blockchain is secured by a highly decentralized masternode network with a built-in randomization mechanism.
Table of contents
- What is TomoChain (TOMO)?
- TomoChain (TOMO) Market Overview
- Analysts’ View on TomoChain (TOMO)
- TomoChain (TOMO) Current Market Status
- TomoChain (TOMO) Price Analysis 2023
- TomoChain (TOMO) Price Prediction 2023-2030 Overview
- TomoChain (TOMO) Price Prediction 2023
- TomoChain (TOMO) Price Prediction 2024
- TomoChain (TOMO) Price Prediction 2025
- TomoChain (TOMO) Price Prediction 2026
- TomoChain (TOMO) Price Prediction 2027
- TomoChain (TOMO) Price Prediction 2028
- TomoChain (TOMO) Price Prediction 2029
- TomoChain (TOMO) Price Prediction 2030
- TomoChain (TOMO) Price Prediction 2040
- TomoChain (TOMO) Price Prediction 2050
- Conclusion
- FAQ
- More Crypto Price Predictions:
TomoChain (TOMO) Market Overview
| 🪙 Name | Viction |
| 💱 Symbol | VIC |
| 🏅 Rank | #1241 |
| 💲 Price | $0.037240236933846 |
| 📊 Price Change (1h) | 0.03 % |
| 📊 Price Change (24h) | -2.49 % |
| 📊 Price Change (7d) | -6.9 % |
| 💵 Market Cap | $4741594.5158292 |
| 💸 Circulating Supply | 127324499.15 VIC |
| 💰 Total Supply | 210000000 VIC |
Viction (VIC) is currently trading at $0.037240236933846 and sits at number #1241 on CoinMarketCap in terms of market capitalization. There are 127324499.15 VIC coins currently in circulation, bringing the total market cap to $4741594.5158292.
Over the past 24 hours, Viction has decreased by 2.49%. Looking at the last week, the coin is down by 6.9%.
Analysts’ View on TomoChain (TOMO)
Magic Square, an engagement platform for Web 3 ecosystems tweeted that TomoChainANN’s LuaSwap, a multi-chain trading, yield farming, and launchpad platform delivers a community-governed protocol via the LUA token.
TomoChain (TOMO) Current Market Status
TOMO has a circulating supply of 101,082,726 TOMO coins, while its maximum supply is unavailable, according to CoinMarketCap. At the time of writing, TOMO is trading at $1.47 representing 24 hours decrease of 3.66%. The trading volume of TOMO in the past 24 hours is $39,970,979 which represents a 68.11% decrease.
Some top cryptocurrency exchanges for trading TOMO are Binance, Deepcoin, BingX, Bitrue, and Bybit.
Now that you know TOMO and its current market status, we shall discuss the price analysis of TOMO for 2023.
TomoChain (TOMO) Price Analysis 2023
Currently, TomoChain (TOMO) ranks 176 on CoinMarketCap. Will TOMO’s most recent improvements, additions, and modifications help its price go up? First, let’s focus on the charts in this article’s TOMO’s price forecast.
TomoChain (TOMO) Price Analysis – Bollinger Bands
The Bollinger bands are a type of price envelope developed by John Bollinger. It gives a range with an upper and lower limit for the price to fluctuate. The Bollinger bands work on the principle of standard deviation and period (time).
The upper band as shown in the chart is calculated by adding two times the standard deviation to the Simple Moving Average while the lower band is calculated by subtracting two times the standard deviation from the Simple Moving Average. When the bands widen, it shows there’s going to be more volatility and when they contract, there is less volatility.
When Bollinger bands are used in a cryptocurrency chart, we could expect the price of the cryptocurrency to reside within the upper and lower bounds of the Bollinger bands 95% of the time. The above thesis is derived from an Empirical law.
The sections highlighted by red rectangles in the chart above show how the bands expand and contract. When the bands widen, we could expect more volatility, and when the bands contract, it denotes less volatility.
The green rectangles show how TOMO retraced after touching the upper band (overbought) and lower band (oversold). Additionally, the blue rectangle shows how TOMO tested, and broke the upper bands on numerous occasions after receiving support at the Simple Moving Average (SMA).
Currently, TOMO seems to be moving into the proximity of the bounds of the Bollinger bands, after being above the upper band. If TOMO moves into the range of the Bollinger bands, we could expect it to rebound off of the SMA and test the upper band once again. Moreover, the Bollinger Bandwidth indicator (BBW) shows a value of 0.72, with the line still heading upwards.
The bands started squeezing only after reaching 0.73, 0.75, and 0.78 on the indicator. Hence, we may see the bands gaping its jaws for a little while. As such, we may see a big drop in prices in the name of market correction.
Sellers may need to take precautions and short their tokens at the nick of time before TOMO further depreciates. However, some may hold their tokens waiting for the next rally, as the Bollinger bands are facing upwards.
During the market correction, we may see a great magnitude of price fall. However, the question is, will the Simple Moving Average come to TOMO’s rescue as a support level just like at other times? If it does, then it could present an excellent entry point for long-position holders.
TomoChain (TOMO) Price Analysis – Relative Strength Index
The Relative Strength Index is an indicator that is used to find out whether the price of a security is overvalued or undervalued. As per its name, RSI indicators help determine how the security is doing at present, relative to its previous price.
Moreover, it has a signal line which is a Simple Moving Average (SMA) that acts as a yardstick or reference to the RSI line. Hence, whenever the RSI line is above the SMA, it is considered bullish; if it’s below the SMA, it is bearish.
When considering the first green rectangle from the left of the chart below we can see that the RSI is above the signal. Hence, TOMO is bullish and as a result, it is making higher highs.
The second green rectangle shows that the RSI line (purple) is below the Signal line (yellow). As such, TOMO is bearish or losing value. Therefore it is reaching lower lows as shown in the chart.
Moreover, the RSI could also be used to find out the divergence. For instance, when the token is making higher highs then the RSI should also be making higher highs in unison with it for it to be called a bull run. However, if the RSI does not make higher highs with the token, then we could say that there could be a trend reversal, as the token is losing value despite making higher highs.
Currently, the RSI of TOMO is extremely overbought. On the RSI indicator, it shows a value of 76.41 while the Stochastic indicator also states that TOMO is overbought. Moreover, both indicators show that the lines are heading towards the normal region from being overbought. As such, we may expect a price correction.
During this price correction, we may TOMO reaching for support at the Crossover Overbought (green line). Nonetheless, in the event that TOMO doesn’t receive support at this point then it would crash further to the Crossunder Overbought region (blue line). Since the blue line has been a good spot for finding support we may see TOMO fall till this line.
As such, those shorting TOMO may consider shorting it before reaching the Crossunder Overbought region. Moreover, since TOMO may ricochet off of the blue line and rise, this could present an excellent entry point for buyers.
The above thesis could be proved following the TOMO token’s behavior of reaching for Support at the blue line during its exponential rise.
TomoChain (TOMO) Price Analysis – Moving Average
The Exponential Moving averages are quite similar to the simple moving averages (SMA). However, the SMA equally distributes down all values whereas the Exponential Moving Average gives more weightage to the current prices. Since SMA undermines the weightage of the present price, the EMA is used in price movements.
The 200-day MA is considered to be the long-term moving average while the 50-day MA is considered the short-term moving average in trading. Based on how these two lines behave, the strength of the cryptocurrency or the trend can be determined on average.
In particular, when the short-term moving average (50-day MA) approaches the long-term moving average (200-day MA) from below and crosses it, we call it a Golden Cross.
Contrastingly, when the short-term moving average crosses the long-term moving average from above then, a death cross occurs.
Usually, when a Golden Cross occurs, the prices of the cryptocurrency will shoot up drastically, but when there’s a Death Cross, the prices will crash.
Whenever the price of cryptocurrency is above the 50-day or 200-day MA, or above both we may say that the token is bullish (Grey Arc). Contrastingly, if the token is below the 50-day or 200-day, or below both, then we could call it bearish (Blue triangle section).
The chart above shows how the stranglehold of the bears where negated by the bulls during the dawn of 2023. As such, we could see TOMO rise exponentially. Furthermore, the Golden Cross that happened also gave more momentum to TOMO’s rise.
Moreover, the 50-day MA has been good support for TOMO when it had small corrections while it was rising. However, when TomoChain reached the highest point and started tumbling down, the 50-day MA wasn’t able to support it.
As such, it is important to adjudicate whether TOMO is now making small corrections or whether it is falling after reaching its highest level. To find out his trader may want to use volume, bear bull power, and other indicators or a combination of indicators as per their discretion.
TomoChain (TOMO) Price Analysis – Elder Force Index
Elder Force Index is an indicator that was invented by Alexander Elder, who was an entrepreneur. The indicator mainly uses two parameters to adjudicate the buying and selling force and thereby predicts the market trend. In particular, it relies on price change and volume. As such the strength of the buying force or selling force is dependent on either the price change or the volume.
Whenever the EFI is greater than zero, or positive, we could say that the trend is bullish, as there is more buying pressure. However, when the EFI is in the negative zone, we could say that the cryptocurrency is in the negative zone and the selling pressure is more.
Moreover, the Elder Force could also be used to figure out trend reversals and breakouts. For instance when the EFI is making lower highs while the cryptocurrency is making higher highs, then we could say that this is a bearish divergence. However, in the event that the cryptocurrency is making lower lows while the EFI is making higher lows, then it is a bullish divergence represented in the chart.
Currently, the Elder Force Index indicator shows a value of 1.036M with the line heading towards the zero line. Moreover, the Bear-Bull Power(BBP) indicator also shows that the power of the bull is reducing as the line at 0.7476 on the BBP indicator is heading toward zero.
Moreover, when considering the past occasions when the EFI retraced after reaching this extreme positive region, we could see that there is only one point of EFI going bullish. Now that the EFI of TOMO is moving from 1.04M, we could expect it to rise again after reaching 701.9K.
TomoChain (TOMO) Price Prediction 2023-2030 Overview
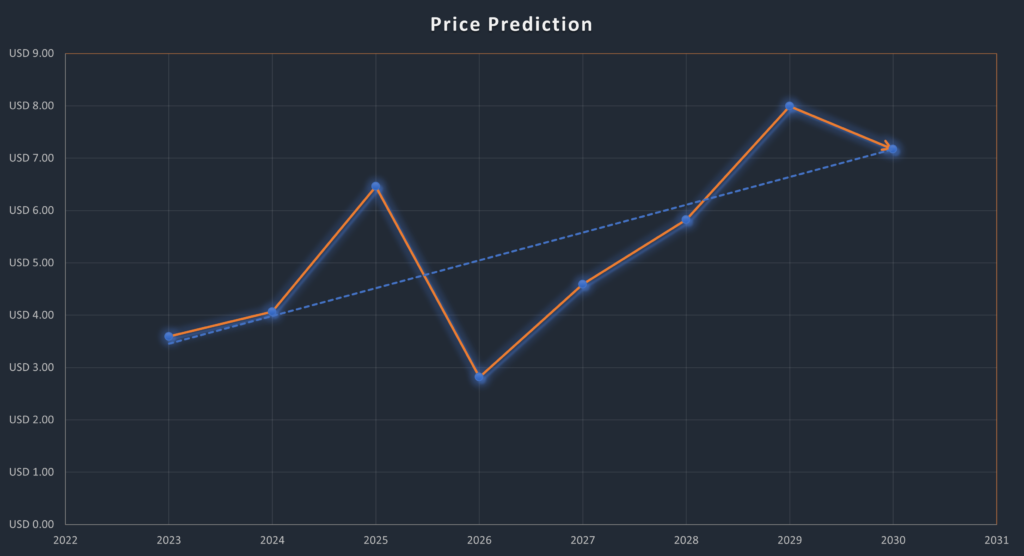
| Year | Minimum Price | Average Price | Maximum Price |
| 2023 | $2.912 | $3.5905 | $3.7812 |
| 2024 | $3.9125 | $4.0667 | $4.5870 |
| 2025 | $5.912 | $6.4587 | $5.781 |
| 2026 | $1.9721 | $2.8156 | $3.1251 |
| 2027 | $4.2153 | $4.589 | $4.9251 |
| 2028 | $5.2510 | $5.8236 | $6.2150 |
| 2029 | $6.9102 | $7.9927 | $8.5211 |
| 2030 | $6.5251 | $7.1696 | $7.5321 |
| 2040 | $11.971 | $12.7023 | $13.251 |
| 2050 | $17.251 | $18.2872 | $19.250 |
TomoChain (TOMO) Price Prediction 2023
When considering the chart above, we could see that TomoChain has been rising exponentially since the beginning of 2023. After reaching Resistance 1 at $2.185 it corrected its prices as the market deemed it as overbought. However, based on past observations, we could see that from this particular price range, TOMO surged to reach Resistance 4 at $3.59.
TOMO’s route to Resistance 4 was not easy as it was obstructed by hurdles at Resistance 1 ($2.185), Resistance 2 ($2.73), and Resistance 3 ($3.220). We could see that TOMO tested the above-mentioned resistance multiple times when it stumbled upon it.
As a trader, this multiple testing of TOMO could present an excellent opportunity to those who would like to enter the market mid-way through the surge. The pattern of fluctuation is also a scalper’s and intraday traders’ haven. This is because the candlesticks are long, which means the price action or the range of price movement is high.
Contrastingly, if TOMO starts to crash it will look to land on Support 1 at $0.98. In the event that Support 1 is breached, TOMO could crash to Support 2 at $0.44. However, Support 1 and Support 2 are nothing compared to Support 3. As such, TOMO would seek help from Support 3 at $0.261, which has been a fortress for TomoChain.
In the event that TOMO crashes to Support 3, it would present an excellent opportunity for buyers to enter the market. The above notion can be proved by the fact that TOMO gained momentum to rise exponentially two times after being supported by Support 3.
TomoChain (TOMO) Price Prediction – Resistance and Support Levels
When considering the behavior of TOMO was trading above the 1:8 Gann line in its early stages. However, within a brief period of time, TomoChain reached for support from 1:4, 1:3,1:2 and thereafter it crashed below the 1:1. Usually if a cryptocurrency trades above the 1:1 Gann line it is considered bullish, and when it crashes below this line, it is considered bearish.
And thereafter TOMO was heavily reliant on the 1:8 Gann line for support from April 2020 to early 2021. The dawn of 2021 saw TOMO rise above the 2:1 Gann line and fluctuate just under the 1:1 Gann line.
However, this loft abode of TOMO was short-lived. As such it came crashing down and tried to find support along the 2:1 Gann line but the bears were too strong. Hence, it fell below 2:1 and somehow found a moment to rise along the 4:1 Gann line.
In July 2021, TOMO found momentum and reached its highest price almost in a near vertical surge. After testing its highest price range one more time, TomoChain started to fall along the 2:1 Gann line.
The chart above shows how TOMO tested the 6th Fibonacci arc from the center in early 2020. However, after breaking and receiving support off of the same arc, TOMO broke the 78.6% baseline arc. After breaking into that TOMO start descending along that arc.
Nonetheless, the dawn of 2021 brought about a bull run that helped TOMO ascend to the first arc (23.6% arc). Shortly after reaching the first arc, TomoChain started descending and found support at the 50% arc, which catapulted TOMO back into the 23.6% arc. However, this too was short-lived as TOMO crashed once more and found support at 38.2% arc.
The trend reversed at 38.2% arc as TOMO started ascending and reached the 23.6% arc once again but fell short as at other times. This time TOMO fell to 61.8% arc and was only able to test the 50% arc but was rejected.
As such, TOMO further fell and received support from 78.6% arc for some time. Nonetheless, the building bear pressure was too much for that baseline to hold on to. Therefore, currently, TOMO is rising exponentially along the 100% arc line.
We could expect it to test receive support from the 8:1 Gann line if it goes through a market correction. Moreover, if TOMO is able to hold its exponential shape, we could expect it to reach the 4:1 Gann line while it rises along the 100% arc.
TomoChain (TOMO) Price Prediction 2024
There will be Bitcoin halving in 2024, and hence we should expect a positive trend in the market due to user sentiments and the quest by investors to accumulate more of the coin. However, the year of BTC halving didn’t yield the maximum TOMO based on the previous halving. Hence, we could expect TOMO to trade at a price not below $4.0667 by the end of 2024.
TomoChain (TOMO) Price Prediction 2025
TOMO may experience the after-effects of the Bitcoin halving and is expected to trade much higher than its 2024 price. Many trade analysts speculate that BTC halving could create a huge impact on the crypto market. Moreover, similar to many altcoins, TOMO will continue to rise in 2025 forming new resistance levels. It is expected that TOMO would trade beyond the $6.4587 level.
TomoChain (TOMO) Price Prediction 2026
It is expected that after a long period of bull run, the bears would come into power and start negatively impacting the cryptocurrencies. During this bearish sentiment, TOMO could tumble into its support regions. During this period of price correction, TOMO could lose momentum and be way below its 2025 price. As such it could be trading at $2.8156 by 2026.
TomoChain (TOMO) Price Prediction 2027
Naturally, traders expect a bullish market sentiment after the crypto industry was affected negatively by the bears’ claw. Moreover, the build-up to the next Bitcoin halving in 2028 could evoke excitement in traders. However, there will be a dip before TOMO actually surges, as such we could expect TOMO to trade at around $4.589 by the end of 2027.
TomoChain (TOMO) Price Prediction 2028
As the crypto community’s hope will be re-ignited looking forward to Bitcoin halving like many altcoins, TOMO may reciprocate its past behavior during the BTC halving. Hence, TOMO would be trading at $5.8236 after experiencing a considerable surge by the end of 2028.
TomoChain (TOMO) Price Prediction 2029
2029 is expected to be another bull run due to the aftermath of the BTC halving. However, traders speculate that the crypto market would gradually become stable by this year. In tandem with the stable market sentiment, TOMO could be trading at $7.9927 by the end of 2029.
TomoChain (TOMO) Price Prediction 2030
After witnessing a bullish run in the market, TOMO and many altcoins would show signs of consolidation and might trade sideways and move downwards for some time while experiencing minor spikes. Therefore, by the end of 2030, TOMO could be trading at $7.1696
TomoChain (TOMO) Price Prediction 2040
The long-term forecast for TOMO indicates that this altcoin could reach a new all-time high(ATH). This would be one of the key moments as HODLERS may expect to sell some of their tokens at the ATH point.
If they start selling then TOMO could fall in value. It is expected that the average price of TOMO could reach $12.7023 by 2040.
TomoChain (TOMO) Price Prediction 2050
The community believes that there will be widespread adoption of cryptocurrencies, which could maintain gradual bullish gains. By the end of 2050, if the bullish momentum is maintained, TOMO could hit $18.2872
Conclusion
If investors continue showing their interest in TOMO and add these tokens to their portfolio, it could continue to rise. TOMO’s bullish price prediction shows that it could reach the $3.5 level.
FAQ
TomoChain is a public EVM (Ethereum Virtual Machine)-compatible blockchain with low transaction fees, fast confirmation time, double validation, and randomization for security guarantees.
TOMO tokens can be traded on many exchanges like Binance, BingX, Deepcoin, Bitrue, and Bybit.
TOMO has a possibility of surpassing its present all-time high (ATH) price of $3.9177 in 2021.
TOMO is one of the few cryptocurrencies that has shown resilience. If TOMO continues its exponential rise then, it might reach $3.5 soon after it breaks the Resistance 1,2 and 3 levels.
TOMO has been one of the most suitable investments in the crypto space. It is highly volatile, as such, it has quite a margin when its price fluctuates. Hence, traders may be allured to invest in TOMO. It’s a good investment in the short term and in the long term as well.
The present all-time low price of TOMO is $0.1407.
The maximum supply of TOMO is unavailable.
TOMO can be stored in a cold wallet, hot wallet, or exchange wallet.
TomoChain was co-founded by Long Vuong, who is also the CEO of TomoChain Pte. Ltd.
TOMO is expected to reach $3.5905 by 2023.
TOMO is expected to reach $4.0667 by 2024.
TOMO is expected to reach $6.4587 by 2025.
TOMO is expected to reach $2.8156 by 2026.
TOMO is expected to reach $4.589 by 2027.
TOMO is expected to reach $5.8236 by 2028.
TOMO is expected to reach $7.9927 by 2029.
TOMO is expected to reach $7.1696 by 2030.
TOMO is expected to reach $12.7023 by 2040.
TOMO is expected to reach $18.2872 by 2050.
Disclaimer: The views and opinions, as well as all the information shared in this price prediction, are published in good faith. Readers must do their research and due diligence. Any action taken by the reader is strictly at their own risk. Coin Edition and its affiliates will not be held liable for any direct or indirect damage or loss.
More Crypto Price Predictions:
- UMA Price Prediction 2023-2030
- ARPA Price Prediction 2023-2030
- Toncoin (TON) Price Prediction 2023-2030
- Band Protocol Price Prediction 2023-2030
- ImmutableX (IMX) Price Prediction 2023-2030
Disclaimer: The information presented in this article is for informational and educational purposes only. The article does not constitute financial advice or advice of any kind. Coin Edition is not responsible for any losses incurred as a result of the utilization of content, products, or services mentioned. Readers are advised to exercise caution before taking any action related to the company.

: What Happens If You Use an Unlicensed Platform?")


