

- Bitcoin holds above $64,000, keeping its broader bullish structure intact.
- Ethereum shows stronger momentum after reclaiming key moving averages.
- XRP remains bearish as sellers pressure support near the critical $1.00 level.
Bitcoin, Ethereum, and XRP have entered pivotal trading zones as investors assess whether recent price trends will continue or reverse. Bitcoin continues to hold above an important support cluster despite losing momentum near a key Fibonacci level.
Meanwhile, Ethereum maintains a stronger technical position after recovering above several moving averages, giving buyers confidence in the current trend. XRP, however, remains under pressure as bearish momentum dominates the chart.
Bitcoin Price Prediction: BTC Holds Firm Above Major Support
Bitcoin trades near $64,257 after failing to extend gains above the 0.786 Fibonacci retracement at $64,942. However, the pullback has not damaged the broader structure. Instead, the price continues to sit above a tightly packed group of the 20, 50, 100, and 200 exponential moving averages between $63,995 and $64,192.
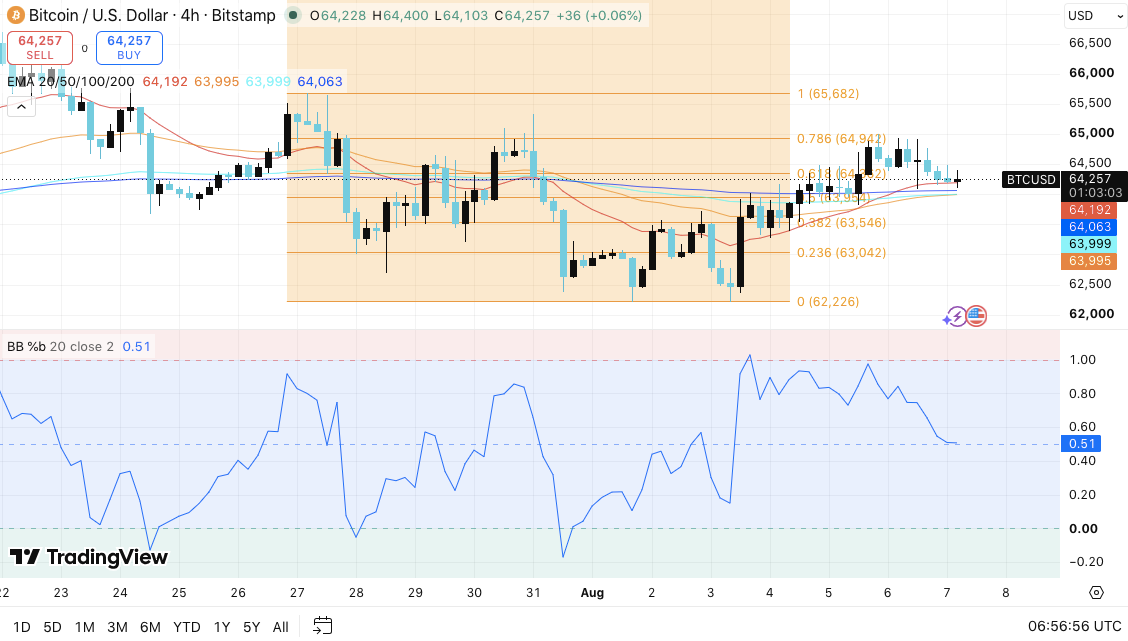
This technical convergence often signals an important turning point. Additionally, the neutral Bollinger Band %B reading shows momentum has cooled without shifting strongly bearish. Buyers continue defending the $64,000 region despite profit-taking across the market.
Related: Meme Coins Price Prediction: Dogecoin (DOGE), Shiba Inu (SHIB), MemeCore (M)
If Bitcoin breaks above $64,942, bulls could challenge the swing high near $65,682. However, losing support at $63,954 may increase selling pressure and expose $63,546 before the market tests $63,042.
Ethereum Price Prediction: ETH Keeps Bullish Structure Intact
Ethereum continues to outperform after recovering from its recent swing low near $1,821. The asset now trades around $1,903 while holding above the 20, 50, 100, and 200 EMAs. Moreover, the successful move above the 0.382 Fibonacci retracement has strengthened confidence among short-term buyers.
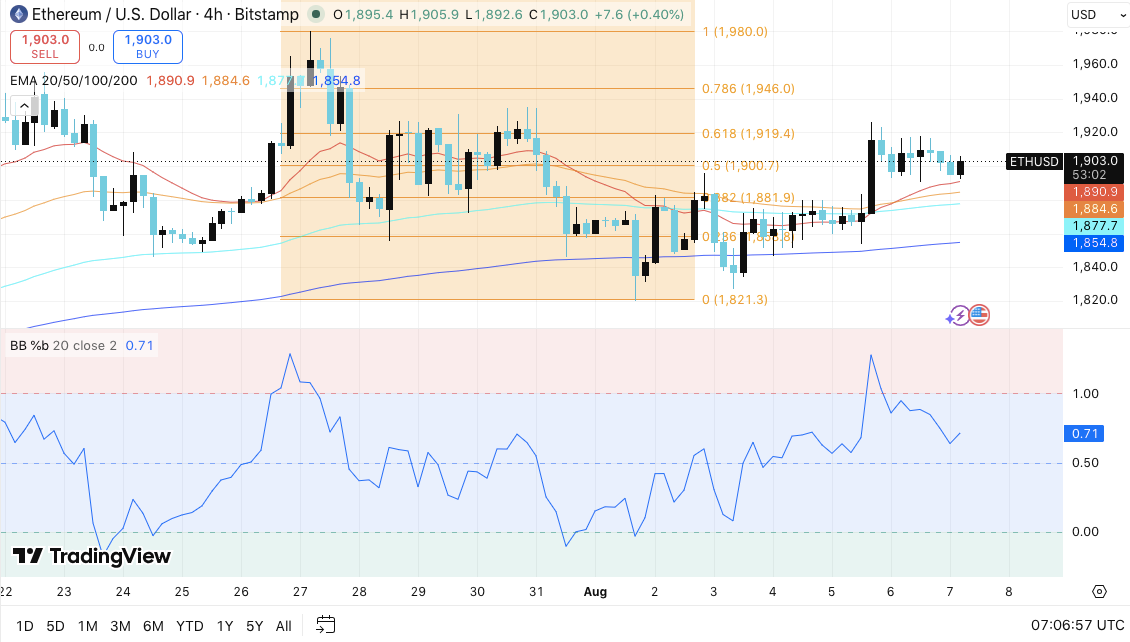
The $1,900 area now serves as immediate support. Besides, the Bollinger Band indicator suggests bullish momentum still has room to expand before reaching overbought conditions.
A decisive move above $1,914 could encourage another rally toward $1,946. Furthermore, clearing $1,980 would confirm stronger upside momentum. On the downside, losing the $1,890 support zone could trigger a retreat toward $1,877 and the 200 EMA near $1,855.
XRP Price Prediction: XRP Searches for Stability After Recent Weakness
XRP remains the weakest performer among the three assets. The token trades near $1.025 while staying below every major short-term moving average. Consequently, the prevailing downtrend remains intact as sellers continue creating lower highs and lower lows.
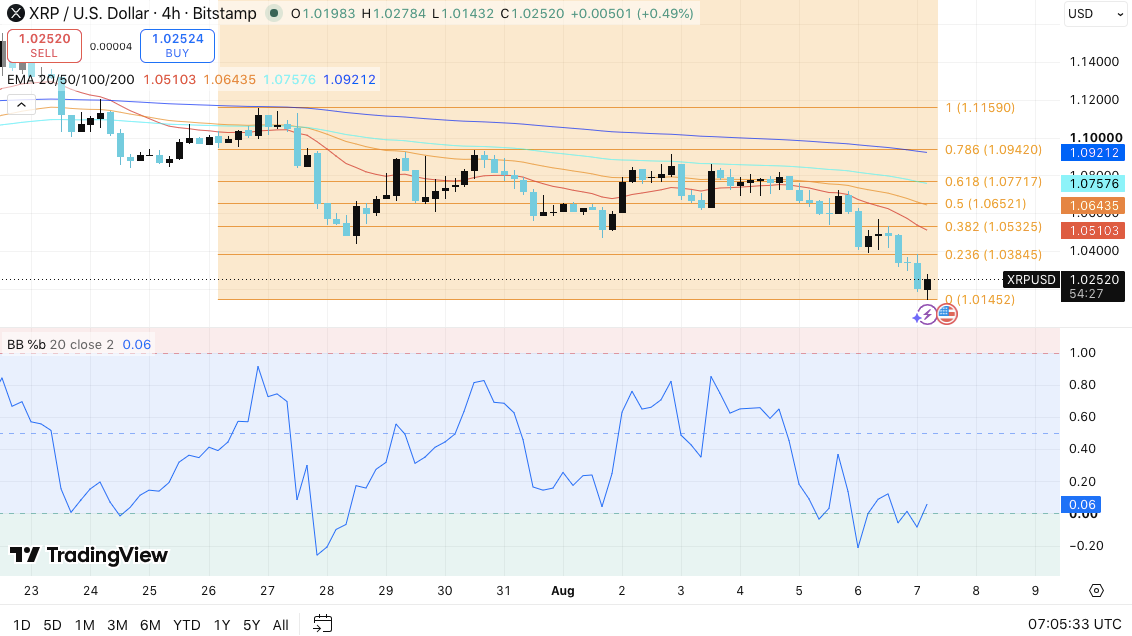
The Bollinger Band %B reading indicates oversold conditions, raising the possibility of a short-term rebound. However, buyers must reclaim resistance between $1.053 and $1.065 before sentiment improves meaningfully.
Failure to defend the immediate support at $1.0145 could send XRP toward the psychological $1.00 level. Additionally, a break below that mark may expose the $0.985 to $0.970 support region.
Disclaimer: The information presented in this article is for informational and educational purposes only. The article does not constitute financial advice or advice of any kind. Coin Edition is not responsible for any losses incurred as a result of the utilization of content, products, or services mentioned. Readers are advised to exercise caution before taking any action related to the company.