


 Price Prediction 2025, 2026, 2027, 2028-2030")
TRON (TRX) has broken out of long-term compression with strong volume and sustained higher lows. With Smart Money breakout confirmation and EMAs aligning bullishly, the asset is now retesting historical liquidity zones that could dictate the trajectory into the next five years.
TRON (TRX) Price Prediction 2025
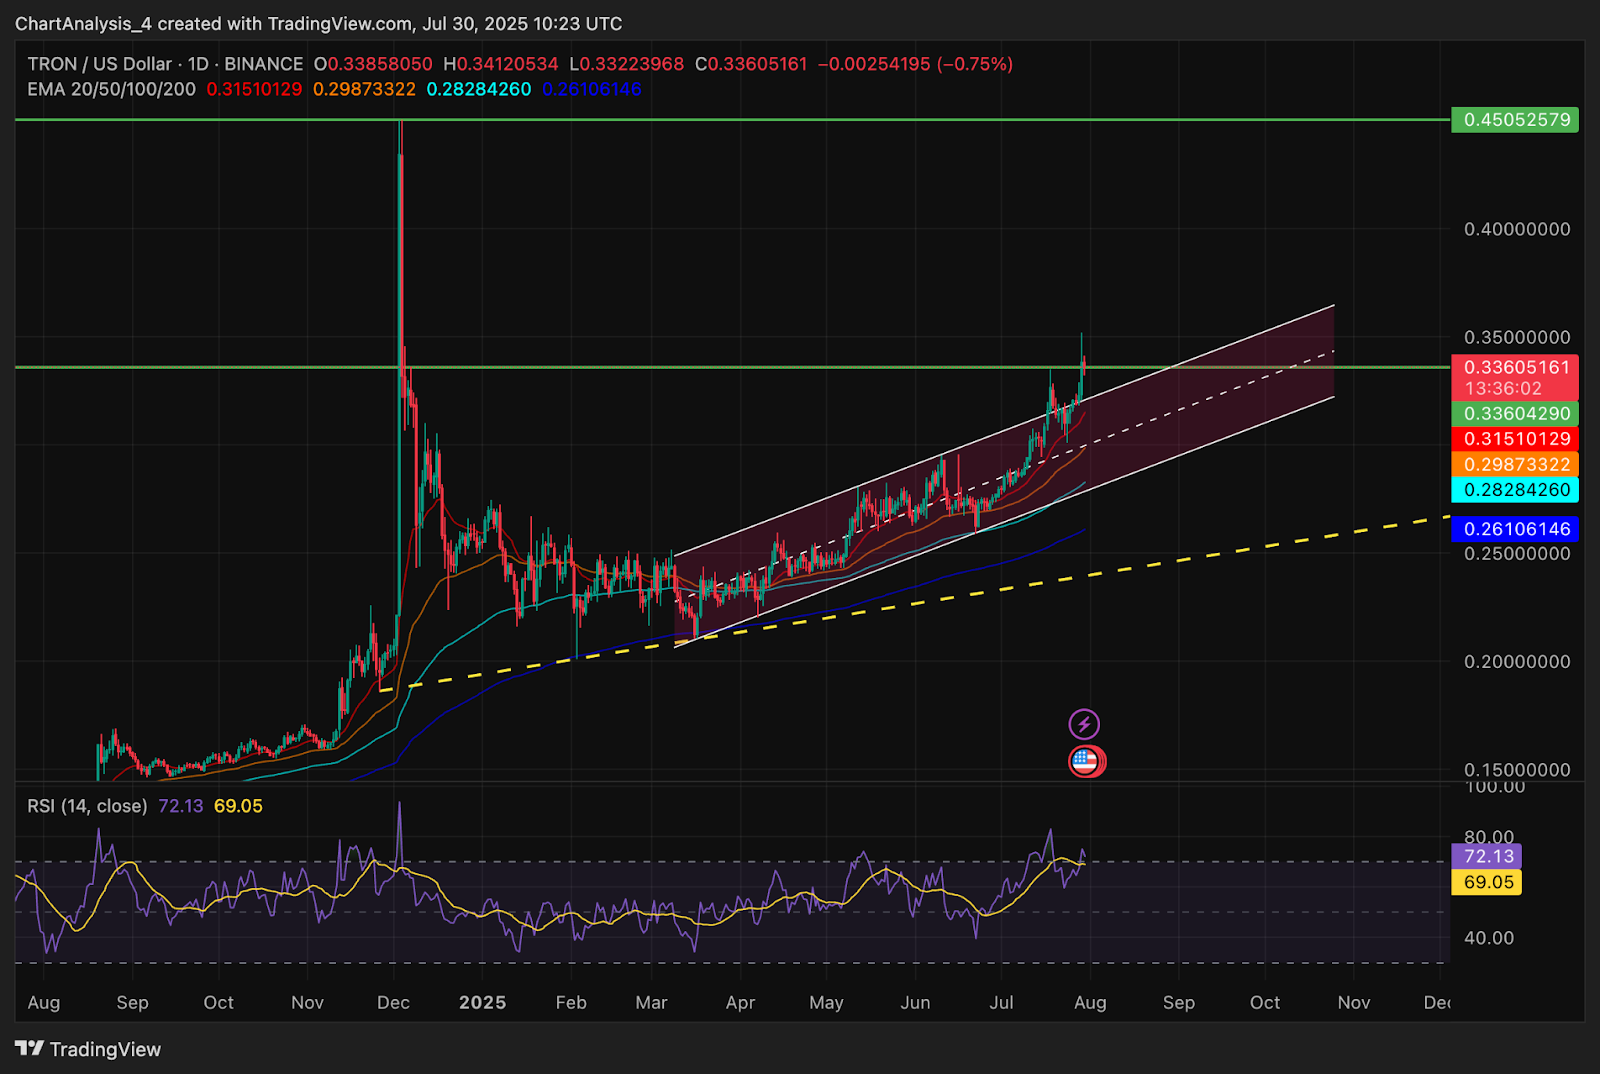
TRON price is currently holding around $0.336 after a strong breakout above the upper boundary of a multi-month ascending channel. This advance follows consistent higher lows since February and a steep incline supported by the 20 and 50 EMAs. TRX is now approaching its weekly weak high target near $0.45, a key zone that previously triggered a volatile rejection.
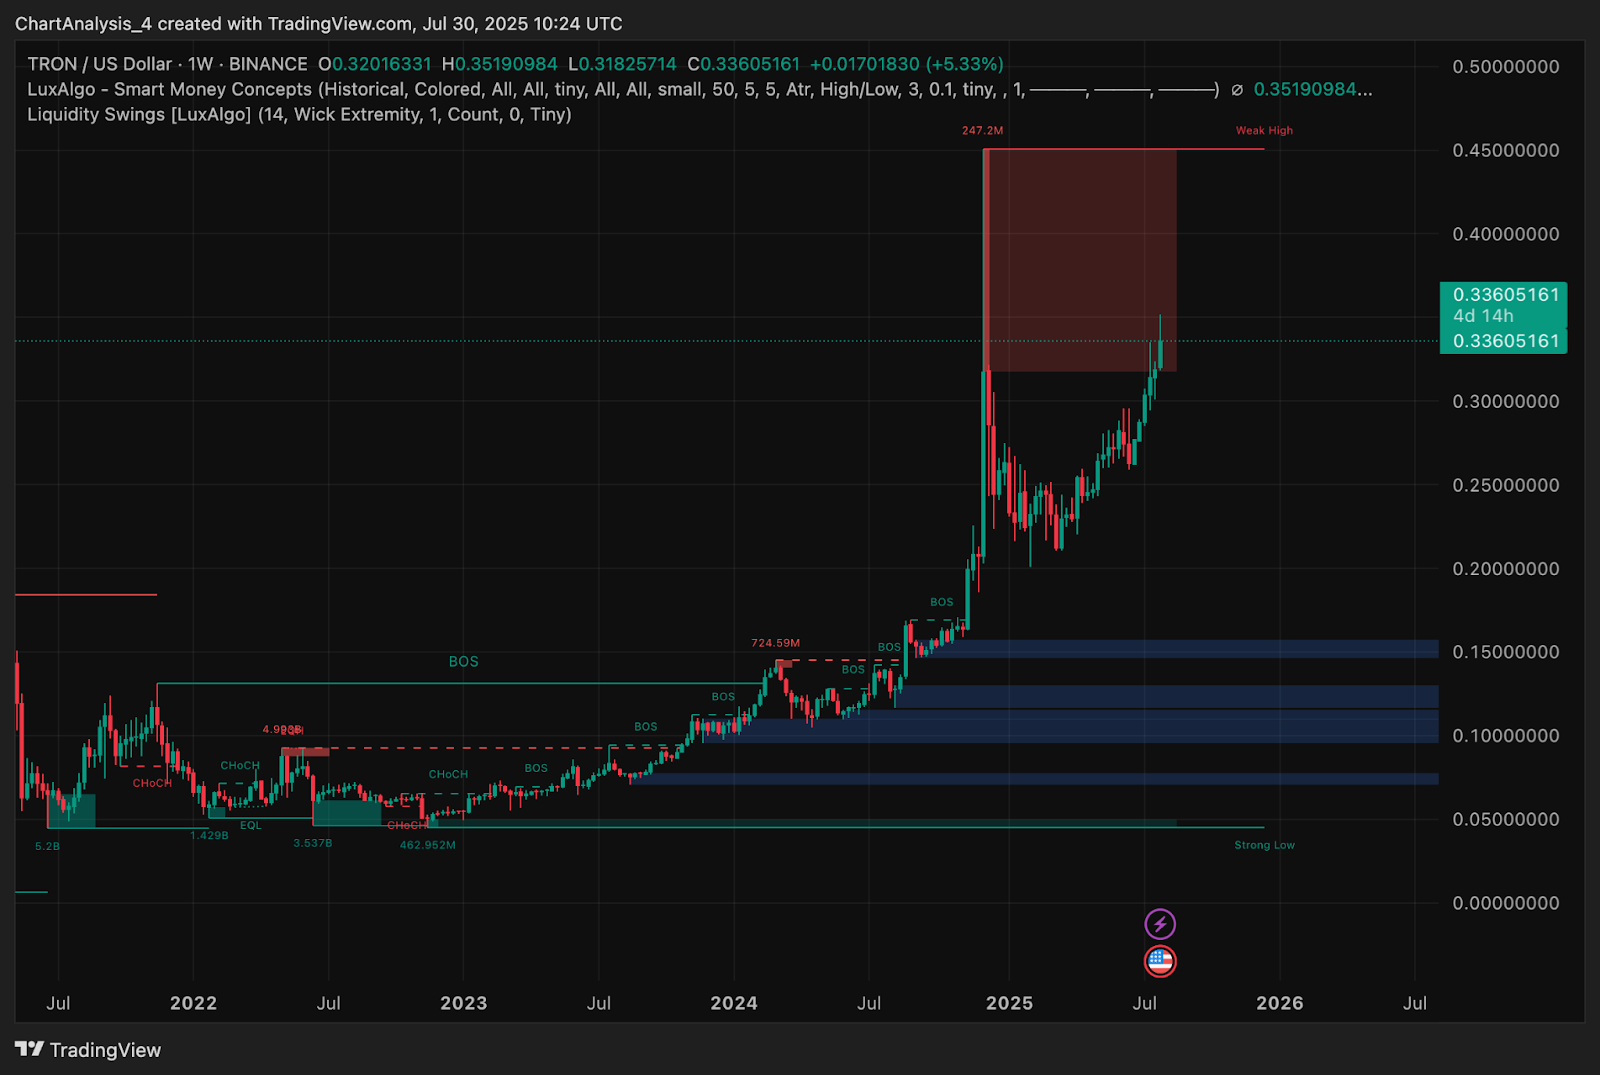
On the daily chart, the asset is riding a parabolic trend supported by Supertrend flip confirmation at $0.30 and EMA confluence above $0.31. RSI is near 72, suggesting strong momentum with potential for further extension. Smart Money indicators have shown multiple BOS (Break of Structure) on both weekly and daily timeframes, confirming trend shift with institutional demand zones now well below current price.
TRON (TRX) Price Analysis (Signals and Indicators)
TRON has moved into a strong bullish structure with the daily EMA ribbon offering dynamic support. The 20/50 EMA cross sustained in early June, with price consistently respecting the ascending channel since then. The RSI above 70 is holding without divergence, signaling sustained trend momentum rather than exhaustion.

DMI values show a clear bullish bias with +DI at 35.08 above -DI at 7.15 and ADX at 47.14, confirming strong trend strength. The Supertrend flipped green near $0.30 and has remained intact, supporting the broader upside case. Weekly BOS and Smart Money CHoCH signals suggest that TRX is now in price discovery, targeting the upper liquidity block near $0.45 and potentially higher if resistance fails.
TRON (TRX) Price Targets 2025–2030
| Year | Potential Low ($) | Potential Average ($) | Potential High ($) |
| 2025 | 0.28 | 0.37 | 0.45 |
| 2026 | 0.31 | 0.44 | 0.60 |
| 2027 | 0.36 | 0.53 | 0.75 |
| 2028 | 0.42 | 0.63 | 0.92 |
| 2029 | 0.49 | 0.75 | 1.12 |
| 2030 | 0.58 | 0.88 | 1.35 |
TRON (TRX) Price Prediction 2026
By 2026, TRON could move deeper into bullish continuation if the $0.45 breakout sustains and consolidates. Price structure suggests any retests of the $0.31–$0.33 zone may act as a base for long entries. Technicals remain favorable, and a close above $0.50 could open the gates toward $0.60, particularly if broader market sentiment remains supportive.
TRON (TRX) Price Prediction 2027
TRX may enter a parabolic phase in 2027 as long as the weekly support near $0.42 holds. With past liquidity zones reclaimed and market maturity improving, the price could gravitate toward $0.75. Volume profile support and previous BOS areas suggest sustained bullish control unless global risk factors create macro headwinds.
TRON (TRX) Price Prediction 2028
In 2028, TRON may benefit from protocol upgrades or enhanced real-world integration. A slow grind above the $0.60–$0.70 range could attract mid-term investors, with $0.92 acting as the next key resistance zone. If TRX sustains consistent demand flow, the path to near-$1 targets becomes viable.
TRON (TRX) Price Prediction 2029
With five years of market development, TRX could become part of a broader DeFi stack or infrastructure utility. In such a scenario, price targets above $1.00 would no longer be speculative. Assuming no breakdown below $0.49, the bullish thesis toward $1.12 would remain intact with continued structure growth.
TRON (TRX) Price Prediction 2030
By 2030, if TRON remains relevant in on-chain utility or cross-chain bridging narratives, price targets near $1.35 could be realistic. The average could hover near $0.88 with higher volatility. Key risk remains in user traction and Layer-1 competition, but the technicals suggest that structural higher highs are achievable.
Conclusion
TRON has entered a robust uptrend, backed by multi-timeframe breakouts, sustained EMA structure, and strong demand flow above historical zones. If it maintains control above $0.30, the multi-year structure could take the asset toward $1.35 by 2030. A confirmed breakout above $0.45 will be critical in validating the higher targets. Long-term investors may eye pullbacks near $0.31–$0.33 as strategic accumulation zones.
Disclaimer: The information presented in this article is for informational and educational purposes only. The article does not constitute financial advice or advice of any kind. Coin Edition is not responsible for any losses incurred as a result of the utilization of content, products, or services mentioned. Readers are advised to exercise caution before taking any action related to the company.


 Price Prediction: Can BTW Sustain Its Breakout Above $0.1032?")

