


- TWT faces a support test at $0.9061 amid bearish pressure.
- Trading activity decreases after TWT’s recent price drop.
- Keltner bands hint at consolidation and a possible bullish breakout.
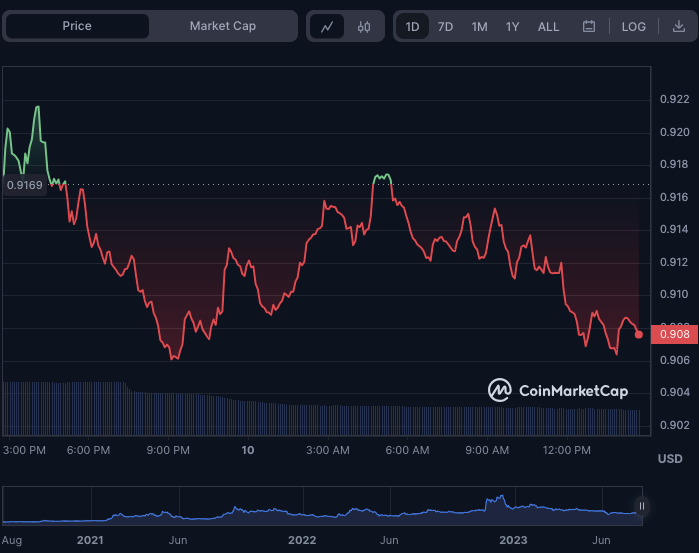
After failing to break through the $0.9231 resistance level, bullish momentum in the Trust Wallet Token (TWT) has retraced in the last 24 hours. As a result, bears took control of the TWT market and dipped the price to a support level of $0.9061.
This level of support has been holding firm, indicating potential buying interest at this price point. However, further consolidation or a break below this level could indicate that the TWT market will remain bearish.
TWT was trading at $0.9076 at publication, indicating a slight recovery from the dip. The current price indicates that buyers are stepping in to prevent further declines.
While TWT’s market capitalization fell by 1.49% to $378,171,358, its 24-hour trading volume fell by 52.72% to $4,458,053, indicating that trading activity in the TWT market has decreased. This drop in trading activity could be attributed to market participants being cautious due to the recent price drop.
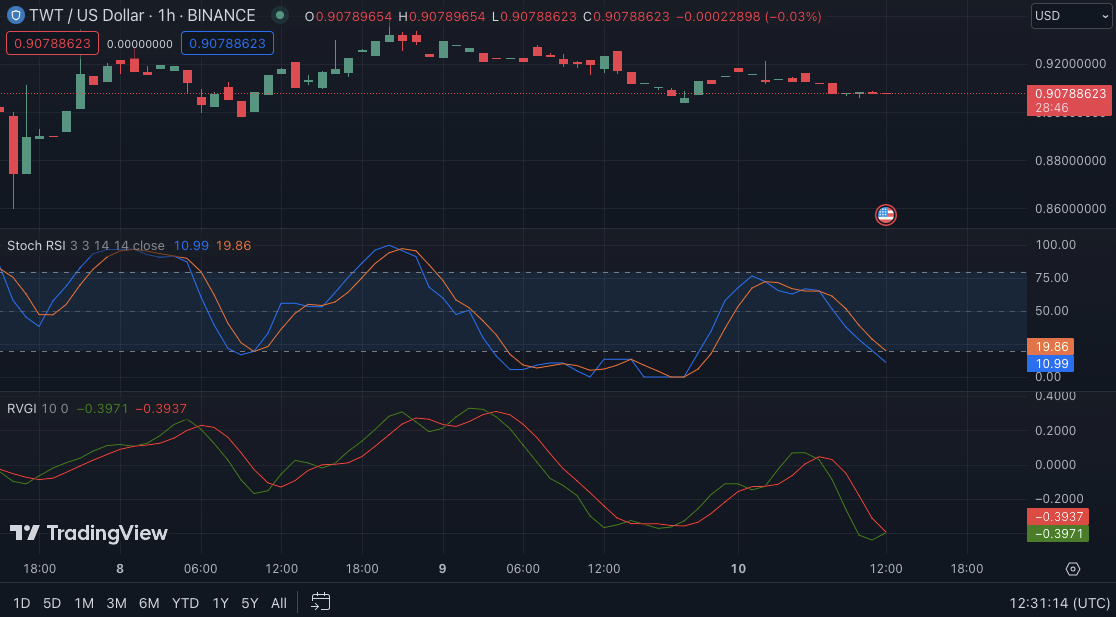
The stochastic RSI in the TWT price chart is in the oversold region with a reading of 10.99, indicating that the TWT token may be undervalued and could see a price reversal. Oversold conditions frequently present a buying opportunity for investors looking to profit from price increases.
When combined with the stochastic RSI, the Relative Vigor Index (RVGI) can provide additional confirmation of a potential price reversal. If the RVGI shows a bullish divergence or begins to rise from oversold levels, it could indicate increased buying pressure and support the possibility of a TWT token price increase.
As a result, the RVGI pointing upwards on the TWTUSD price chart with a reading of -0.3971 as it tries to surpass its signal line suggests that momentum may be shifting to the upside.
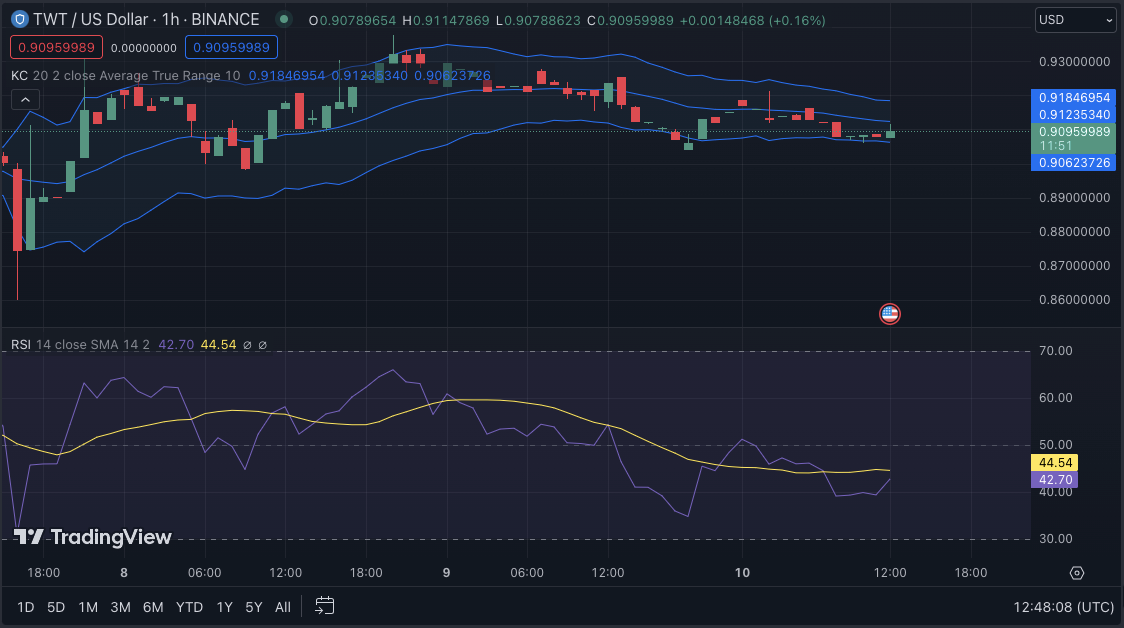
The Keltner Channel bands move linearly, with the upper band touching at 0.91864847, the middle band at 0.91253233, and the lower band at 0.90601619. This pattern suggests a period of consolidation and a possible breakout soon.
Furthermore, the price action has bounced off the lower band, resulting in a green candlestick, which adds to the possibility of an upward movement.
With a reading of 42.70, the Relative Strength Index has shifted upwards towards its signal line, adding to the bullish trend perception. This shift suggests that buying pressure is increasing, and the market is preparing to move higher. If the RSI continues to rise above its signal line and exceeds 50, it will confirm the bullish sentiment and increase the likelihood of a breakout.
In conclusion, TWT’s price holds steady after a retracement, with the potential for an upside reversal as indicators suggest increasing buying pressure.
Disclaimer: The views, opinions, and information shared in this price prediction are published in good faith. Readers must do their research and due diligence. Any action taken by the reader is strictly at their own risk. Coin Edition and its affiliates will not be liable for direct or indirect damage or loss.
Disclaimer: The information presented in this article is for informational and educational purposes only. The article does not constitute financial advice or advice of any kind. Coin Edition is not responsible for any losses incurred as a result of the utilization of content, products, or services mentioned. Readers are advised to exercise caution before taking any action related to the company.


