


- Uniswap dominates on social media platforms.
- However, analysis shows UNI is on a bearish trend.
- Indicators show the bearish trend might continue in the short term.
As the bulls struggle to restore market momentum, Uniswap’s price research indicates a continuation of the bearish trend. Currently trading below the $5.2 support level, the price appears susceptible to further declines if this level is unable to hold. The technical indicators for UNI are likewise bearish, showing that sellers are more inclined than buyers in the near future.
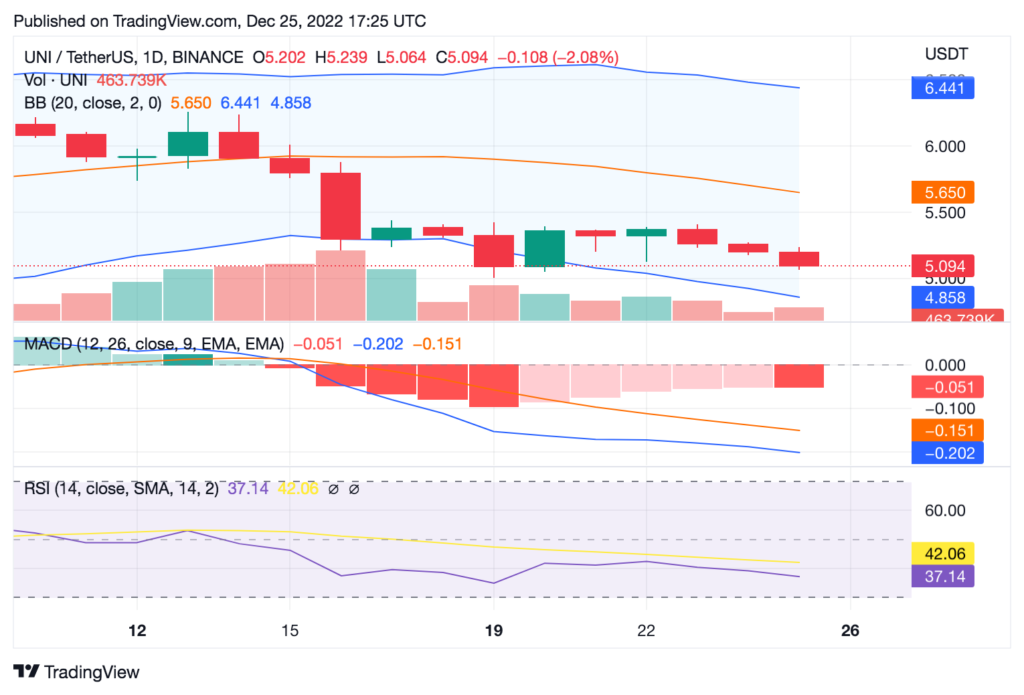
Uniswap began the daily trading session at an intraday low of $5.13 according to the price analysis of the daily chart, and it has since drifted sideways, establishing a descending triangle pattern. The price is moving within the 200 and 100 SMA curves, which shows that the long-term trend is bearish. Additionally, the MACD histogram is currently located below the zero line and suggests a rise in selling pressure.
The lower Bollinger Band is at $5.15 (contracting), while the upper Bollinger Band is at $5.19, all of which point to a strong bear market on the UNI price chart. Prices have been slowly moving up into the lower band, indicating that bear strength is likely to rule, which is another sign that the current market pattern may continue.
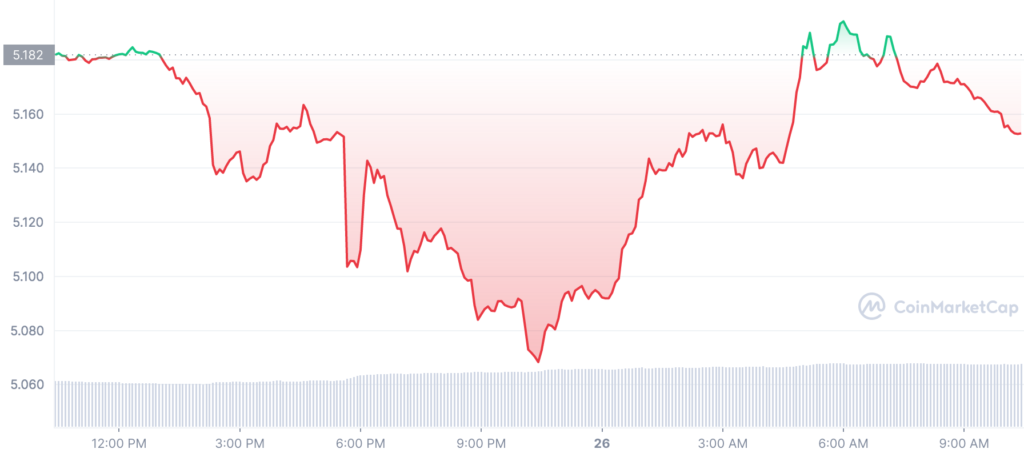
As of the time of writing, UNI is down 0.55% over the previous 24 hours, trading at $5.15. The bearish descending triangle pattern, which is typically interpreted as an indication of a bearish trend, has formed on the UNI cryptocurrency. The coin’s support is located at $5.08, while its resistance is at the $5.2 level.
On the positive side, UNI’s price may move higher in the short term if it is able to break through the solid $5.2 barrier. On the other hand, if the coin breaks through the $5.128 support level, losses may increase and possibly reach its prior lows of $5.10.
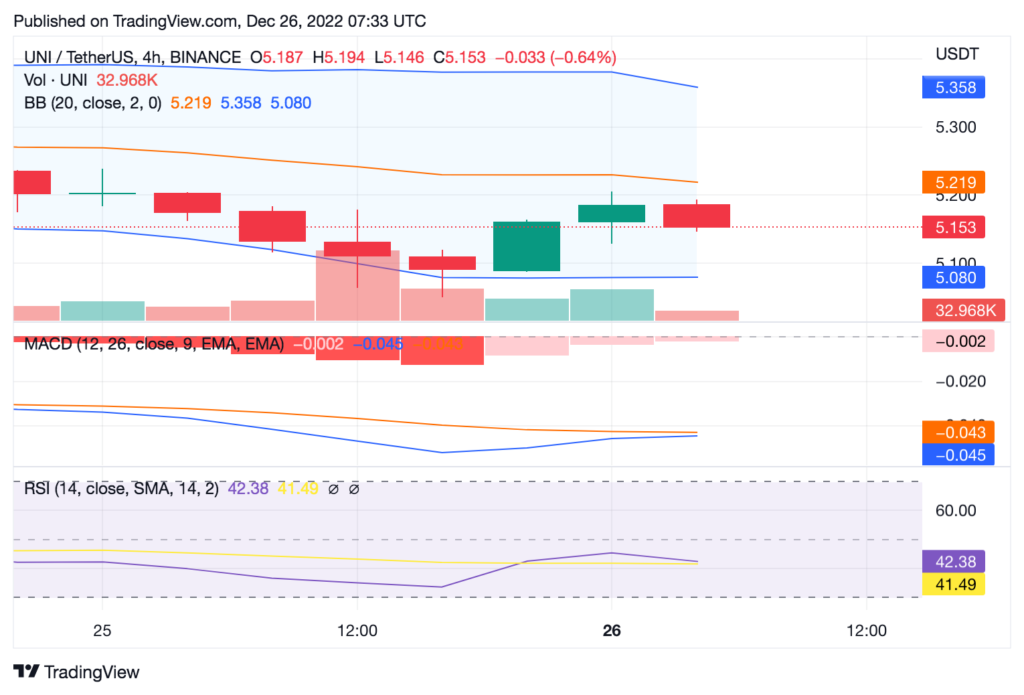
A 4-hour chart analysis reveals that the market has been completely taken over by bears. A significant bearish trend is present since the 50-day SMA has crossed below the 200-day SMA. The MACD is trading in negative territory and exhibiting escalating selling pressure. In order to withstand the bears and reverse the current position, the bulls must keep the support level in place and push prices higher.
Disclaimer: The views and opinions, as well as all the information shared in this price prediction, are published in good faith. Readers must do their research and due diligence. Any action taken by the reader is strictly at their own risk. Coin Edition and its affiliates will not be held liable for any direct or indirect damage or loss.
Disclaimer: The information presented in this article is for informational and educational purposes only. The article does not constitute financial advice or advice of any kind. Coin Edition is not responsible for any losses incurred as a result of the utilization of content, products, or services mentioned. Readers are advised to exercise caution before taking any action related to the company.


