


 Bulls Pull Back as Prices Fall by Over 3.90%")
- According to a recent analysis, VeChain has been dominated by bears.
- VET is facing resistance at $0.02067, with prices retracing by more than 3.90%.
- Technical indicators suggest that the bears will continue to dominate.
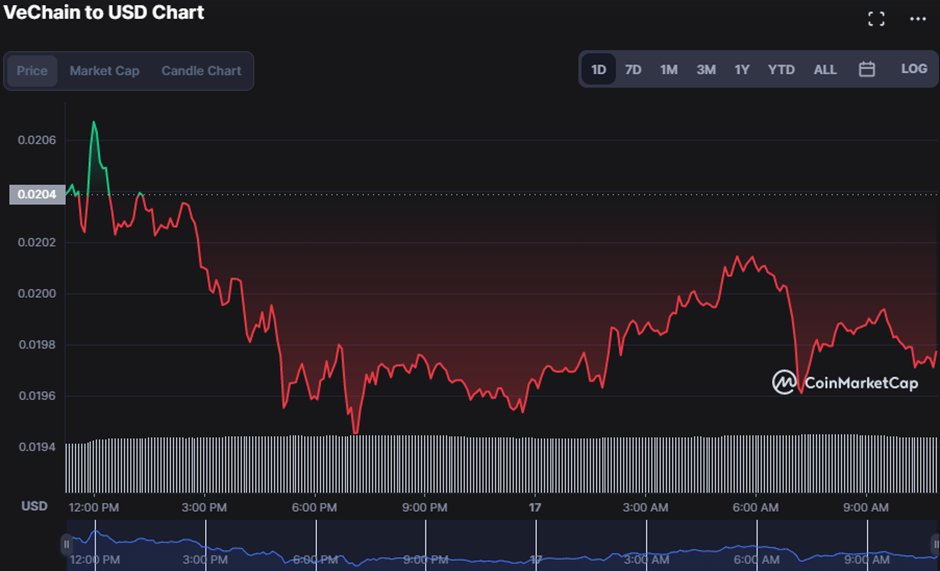
VeChain (VET) experienced sturdiness at its intraday high of $0.02067, and the subsequent decline has been steeper, retracing to lows of $0.01947, portraying a 3.90% setback.
The rising sell-off in its market causes a spike of 11.78% in the 24-hour trading volume to $58,919,595 and a decrease of 3.44% in market capitalization to $1,427,433,524.
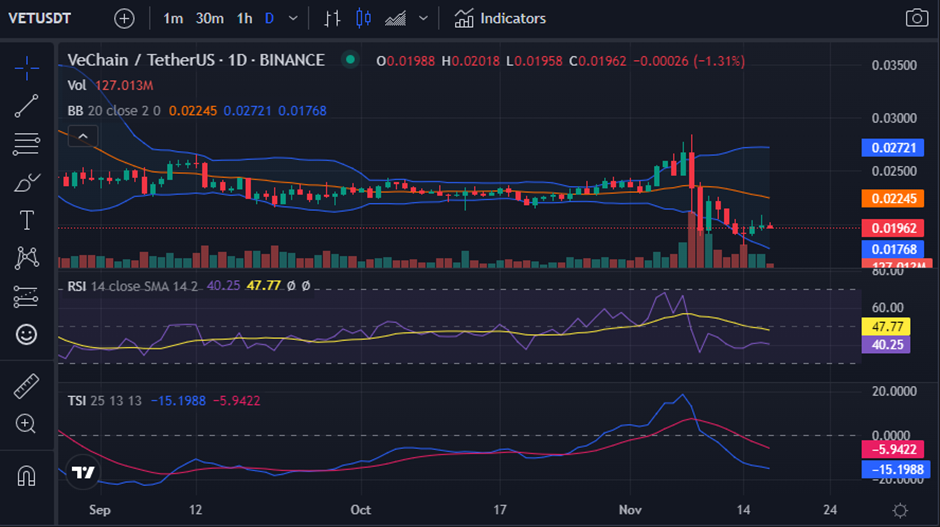
As the Bollinger Band spreads during a market crash, it is anticipated that the selling pressure will intensify, as seen on the VET 1-day price chart, where the upper band reaches 0.02721 and the lower band reaches 0.01768. This recession is being endorsed by a bearish engulfing candlestick pattern and price movement towards the lower band.
The Relative Strength Index (RSI) is presently at 40.28 and moving south towards the oversold region of “20”. This movement suggests that bear primacy will progress if bulls do not intervene to counteract this grizzly trend.
On the VET market, a bearish crossover is visible as the Know Sure Thing indicator crosses the signal line with a reading of -15.988. This movement indicates that bulls have been annihilated by VET bears, and its negative territory trajectory reinforces this notion.
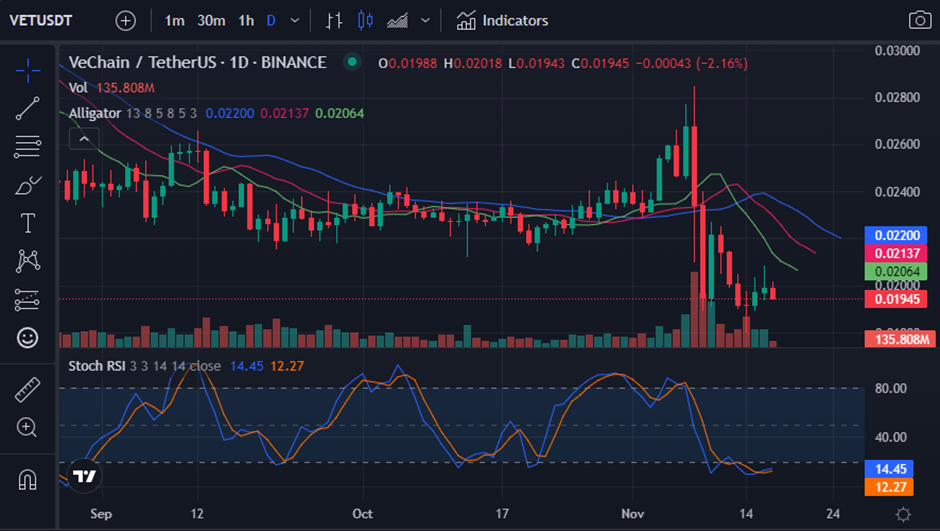
According to Williams Alligator, the three lines are progressing downstream, indicating a negative trend. Because the blue line is above the red line and the red line is above the green line, a downtrend in the VET market is unavoidable unless bulls continue to battle. The blue line (jaw) measures 0.02201, the red line (teeth) measures 0.02138, and the green line (lips) measures 0.02065.
The Stoch RSI reading of 14.54 and pointing upwards, on the other hand, indicates a possible bullish reversal. This reading, which is in the oversold region, sheds some light on VET prices by inferring that the current trend is nearing its end.
Generally speaking, bulls must keep the resistance level and push prices higher to abrogate the current downtrend on the charts.
Disclaimer: The views and opinions, as well as all the information shared in this price analysis, are published in good faith. Readers must do their own research and due diligence. Any action taken by the reader is strictly at their own risk. Coin Edition and its affiliates will not be held liable for any direct or indirect damage or loss.
Disclaimer: The information presented in this article is for informational and educational purposes only. The article does not constitute financial advice or advice of any kind. Coin Edition is not responsible for any losses incurred as a result of the utilization of content, products, or services mentioned. Readers are advised to exercise caution before taking any action related to the company.


