


- Crypto Tony revealed that he is waiting for a bullish ascending triangle to form on VRA’s 12-hour chart.
- According to his post, the formation of this pattern could lead to a positive breakout for VRA.
- Meanwhile, VRA was trading hands at $0.00651 following a 2.46% 24-hour loss.
The cryptocurrency trader and analyst Crypto Tony shared in an X post yesterday that he would like to see an ascending triangle form on the 12-hour chart for Verasity (VRA). According to the post, this pattern emerging in the next few weeks could lead to a strong breakout towards the upside for the altcoin.
From a shorter-term perspective, the altcoin’s price dropped 2.46% over the past 24 hours. According to data from CoinMarketCap, VRA was trading hands at $0.00651 at press time. Although VRA saw its price drop throughout the past day of trading, the cryptocurrency was able to record a 12.72% uptick in its daily trading volume.
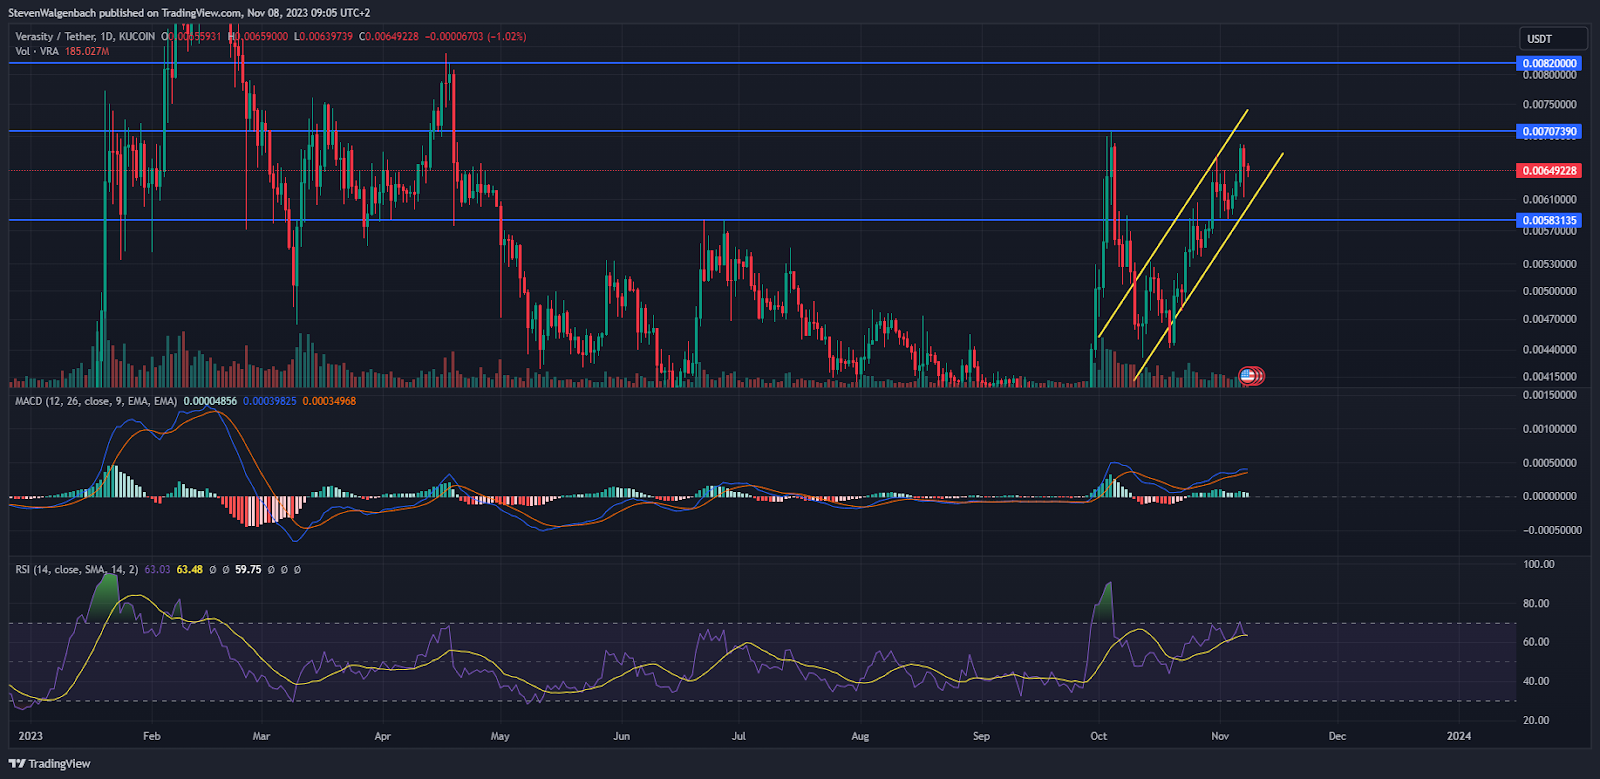
Looking at the daily chart for VRA/USDT, a positive price channel has formed over the past few weeks. During this time, VRA consistently printed higher highs and higher lows. Should this bullish trend continue, the altcoin may attempt to flip the $0.00707390 resistance level into support in the coming few days.
Thereafter, a daily candle close to this barrier could give VRA the foundation to continue to rise in the following week. In this scenario, VRA could climb to as high as $0.0082. This bullish thesis may be invalidated if VRA closes a daily candle below the positive price channel that was present on its daily chart.
Falling out of the ascending channel could lead to VRA pulling back to the immediate support level. This could result in the cryptocurrency dropping to as low as $0.00583135.
Traders and investors will want to note that both the Moving Average Convergence Divergence (MACD) and the daily Relative Strength Index (RSI) indicators were flagging bearish for VRA. At press time, the RSI line was looking to cross below the RSI Simple Moving Average (SMA) line, which could suggest diminishing buyers’ strength.
Meanwhile, the gradient of the MACD histogram is negative. This could signal that VRA’s short-term negative trend may continue in the next 24-48 hours.
Disclaimer: The information presented in this article is for informational and educational purposes only. The article does not constitute financial advice or advice of any kind. Coin Edition is not responsible for any losses incurred as a result of the utilization of content, products, or services mentioned. Readers are advised to exercise caution before taking any action related to the company.


