


- WBT shows consolidation with support at $27.73 and resistance at $27.95.
- Increasing trading volume signals growing interest, but mixed technical indicators.
- RSI below 50 and narrowing MACD suggest potential for future price recovery.
WhiteBIT Coin (WBT), the exchange token for WhiteBIT, is currently trading at $27.82 early Monday, showing an ample 0.36% gain over 24 hours.
The price has moved narrowly, mostly between $27.73 and $27.76 for much of the day, pointing to a short-term period where price finds balance after earlier moves.
Where Are WBT’s Key Support and Resistance Areas Now?
The WBT price chart shows an upward trajectory with periods of consolidation. The price has tested the $27.73 to $27.76 level multiple times, and each time, it has bounced back. The $27.70 level also briefly held price during a small dip before it climbed back.
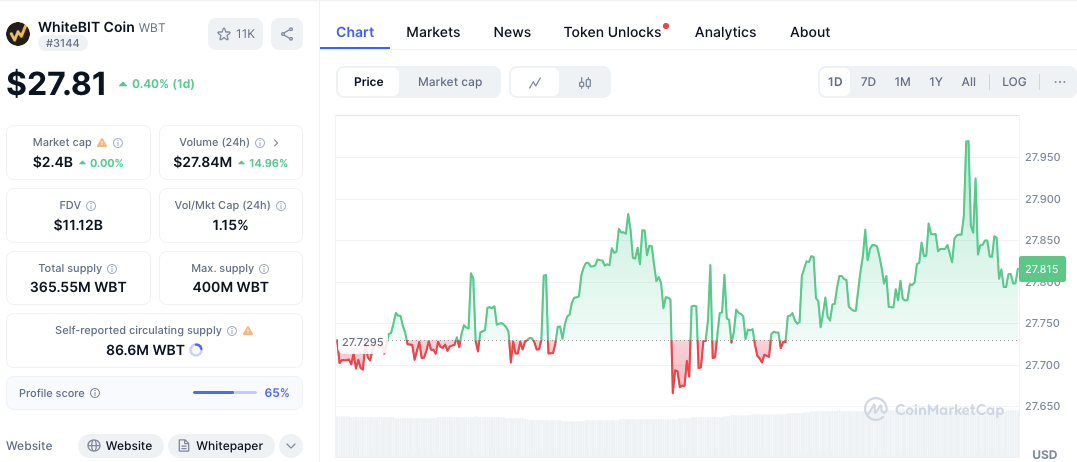
On the resistance side, $27.95 is the highest point observed today. Attempts to push past this specific level failed, making it the clear short-term resistance, as the price was rejected several times at this point.
Another resistance range exists between $27.90 and $27.93. Price attempts to break higher in this zone have consistently failed, reinforcing the strength of this resistance area.
Related: WhiteBIT Expands Collateral Asset List: Over 80 Tokens Now Supported
WBT Volume Climbs, But Do RSI & MACD Confirm Strength Yet?
The 24-hour trading volume for WBT is currently at $27.83 million, which marks a notable increase of 14.32%. This suggests that interest in WBT is growing, and there may be momentum building.
Still, despite more trading action, technical gauges like RSI and MACD give a mixed picture currently.
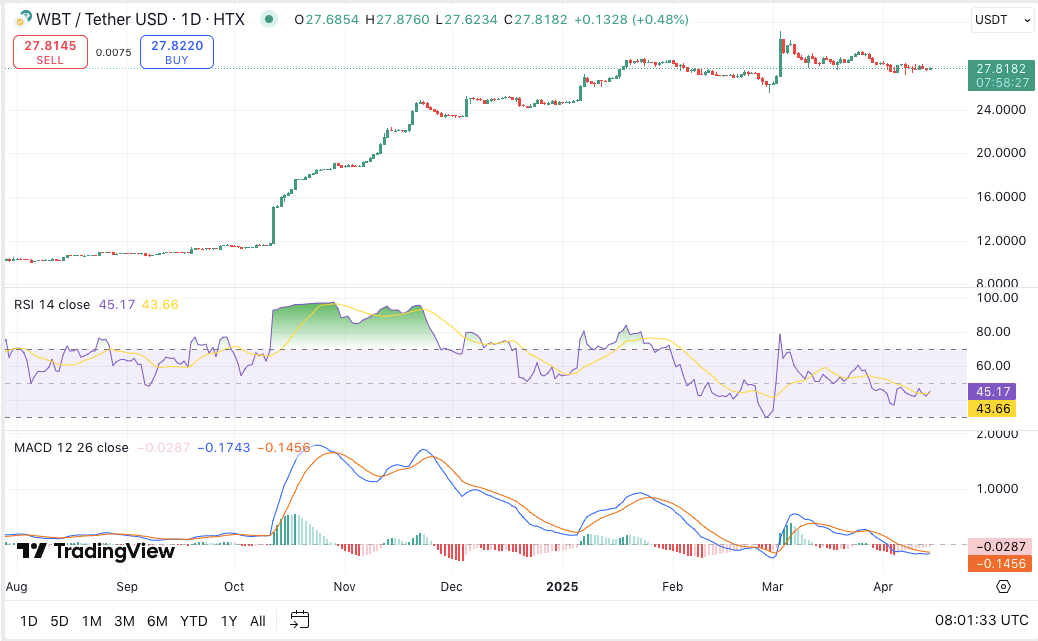
The RSI currently reads 44.98, a neutral reading just below the 50 midpoint, suggesting buying strength is present but not forceful. The indicator sits just above technically ‘oversold’ conditions, hinting upward price room might be limited unless more buyers step in.
Related: WhiteBIT’s WBT Token Hikes 5% Ahead of Listing on Bitfinex
Moreover, the MACD shows a bearish crossover, with the MACD line at -0.0293 and the signal line at -0.1458. While the MACD is currently below the signal line, the gap between them is narrowing. This closing gap can sometimes mean downward price energy is fading, possibly setting up a positive crossover later if price steadies or turns up.
Disclaimer: The information presented in this article is for informational and educational purposes only. The article does not constitute financial advice or advice of any kind. Coin Edition is not responsible for any losses incurred as a result of the utilization of content, products, or services mentioned. Readers are advised to exercise caution before taking any action related to the company.


 Price Prediction for July 2026: Can Bulls Push Above $75 for a Stronger Recovery?")
