


- Lookonchain revealed in a tweet yesterday that a whale withdrew 2 trillion PEPE from Binance in the past 48 hours.
- The platform shared that the whale also withdrew 3.94 trillion PEPE on 27 June and 5 July 2023.
- At press time, PEPE was trading at $0.000001477 following a 1.28% 24-hour price drop.
Lookonchain, the on-chain analysis platform, revealed in a tweet yesterday that a whale withdrew 2 trillion Pepe (PEPE), estimated to be worth $3 million, from Binance over the past 48 hours. This is not the first PEPE withdrawal executed by this whale, as the platform shared that he also withdrew 3.94 trillion PEPE from Binance on 27 June and 5 July 2023.
At press time, the meme coin’s price was down 1.38% over the past 24 hours according to CoinMarketCap. As a result, PEPE was changing hands at $0.000001477. The altcoin not only weakened against the US Dollar but, was also outperformed by the two market leaders Bitcoin (BTC) and Ethereum (ETH) over the past 24 hours.
PEPE was down 0.97% against BTC and 1.28% against the altcoin leader ETH. This meant that 1 PEPE was worth approximately 0.000000000049 BTC and 0.000000000787 ETH at press time.
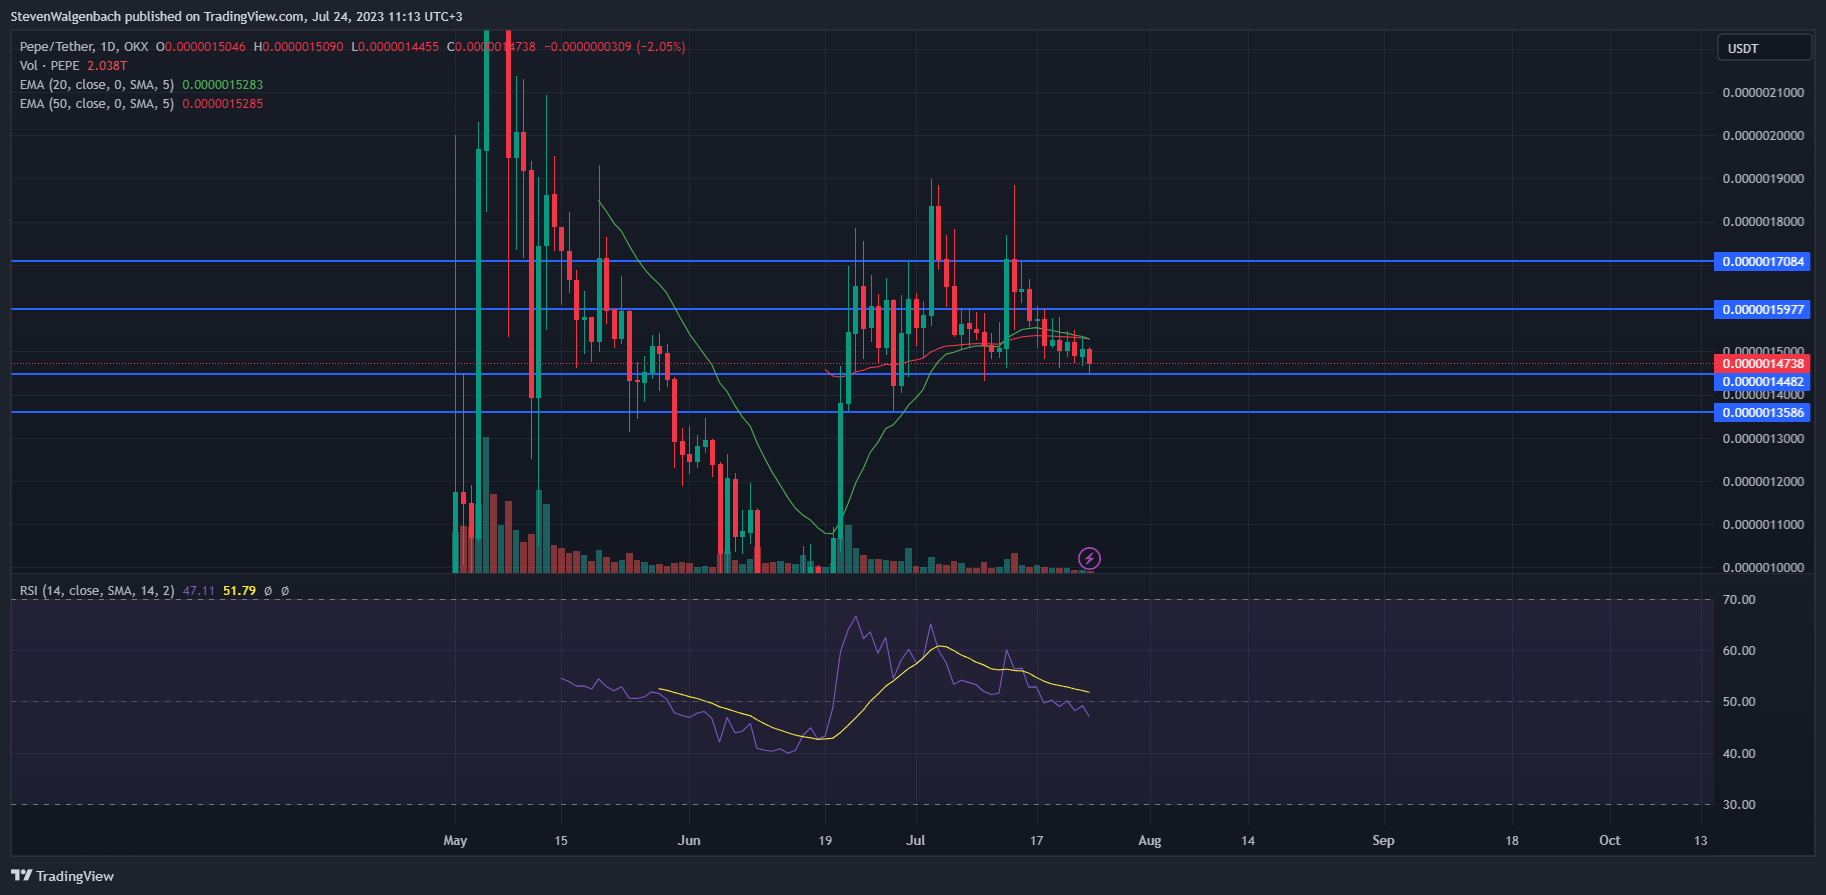
From a technical perspective, PEPE was resting on a key support level at $0.0000014482. Should it close today’s daily candle below this major price point, it may be at risk of falling to the next crucial support at $0.0000013586 in the next 24-48 hours.
Conversely, a daily close above the 20-day EMA line at $0.0000015282 may be an early sign of PEPE challenging the next major resistance level at $0.0000015977 in the upcoming couple of days. Continued buy pressure may lead to the meme coin flipping this level into support and potentially testing the $0.0000017084 resistance as well.
Something to take note of is the fact that the 20-day EMA line was attempting to cross below the longer 50-day EMA line. Should these two technical indicators cross, it will be a significant bearish technical flag that will indicate medium-term momentum is in favor of bears.
Disclaimer: The views and opinions, as well as all the information shared in this price analysis, are published in good faith. Readers must do their own research and due diligence. Any action taken by the reader is strictly at their own risk. Coin Edition and its affiliates will not be held liable for any direct or indirect damage or loss.
Disclaimer: The information presented in this article is for informational and educational purposes only. The article does not constitute financial advice or advice of any kind. Coin Edition is not responsible for any losses incurred as a result of the utilization of content, products, or services mentioned. Readers are advised to exercise caution before taking any action related to the company.
: What Happens If You Use an Unlicensed Platform?")


