


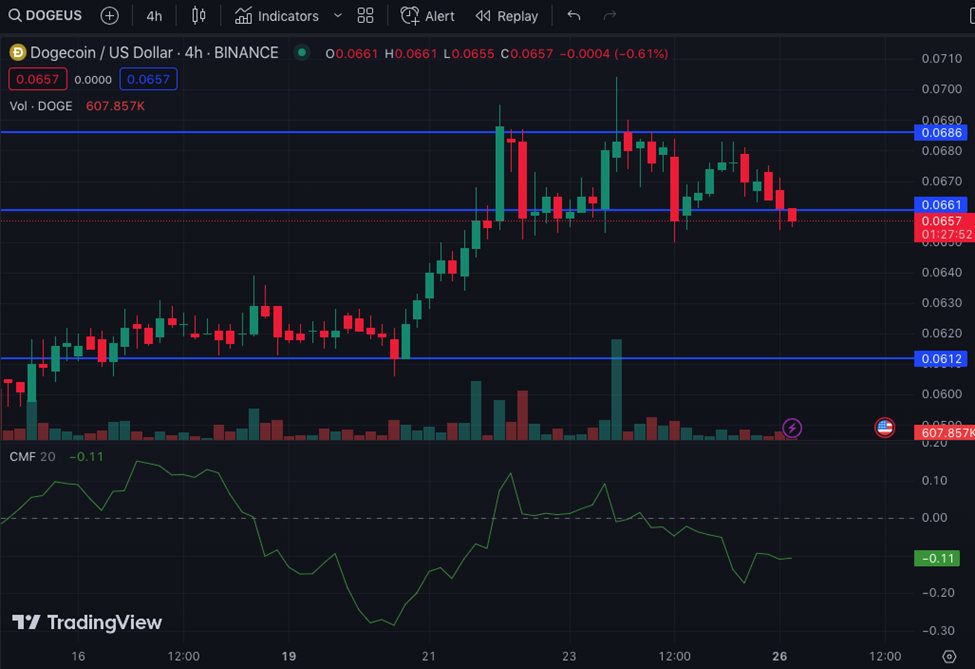
- The CMF drop to -0.11 suggests that DOGE had lost the strength behind its uptrend.
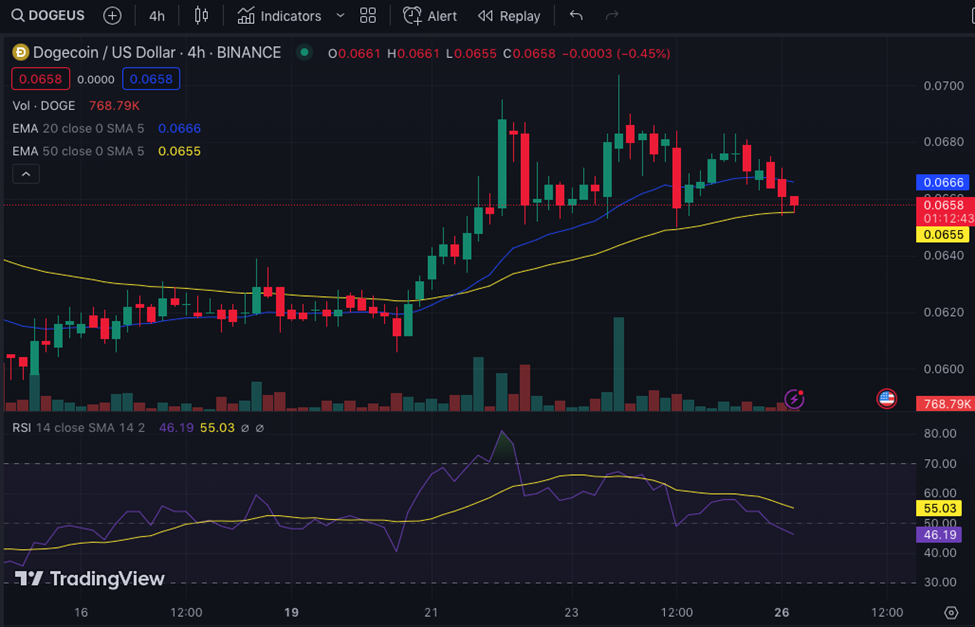
- The RSI indicated that there was low demand but enough to keep the price above water.
- DOGE could end up consolidating in the short term and Open Interest shrunk.
Dogecoin’s (DOGE) recovery over the last week has hit a stumbling block as the 24-hour price decreased by 2.62%. Between June 20 and 23, DOGE surged from $0.060 to $0.68. However, the decrease in price has forced the meme into narrow consolidation over the last few days.
From the 4-hour chart, DOGE’s bullish thesis began intense formation at $0.0612. Like Bitcoin (BTC), DOGE alongside other cryptocurrencies enjoyed the hike due to an increase in institutional interest.
Less flow, reduced strength
Despite the extended rally period, the uptrend experienced a crack due to heavy selling pressure at $0.0686. While the downtrend was thwarted by support created at $0.0600, oscillating buy and sell orders could not keep the DOGE upward momentum constant.
Meanwhile, liquidity flow into DOGE has significantly dropped as indicated by the Chaikin Money Flow (CMF).
The indicator drop to -0.11 signals a reduction in buying pressure. Hence, the bullish momentum was waning. If the CMF downtrend continues, DOGE’s hold on $0.066 might be called into question.
Furthermore, the Relative Strength Index (RSI), having attempted to reach an overbought point of 70, fell to 46.19.
At the aforementioned value, the RSI indicates that there was still some buying pressure present. However, a declining RSI indicates increased control by bears. Hence, the drop could follow in the footsteps of the CMF, and result in a loss of the $0.06 region.
Chances of resistance
But unlike the CMF and RSI, the Exponential Moving Average (EMA) revealed a different tale. As of this writing, the 20 EMA (blue) had crossover the 50 EMA (yellow).
As a result, the short to intermediate price trend could be bullish, or at least neutral. This, however, depends on the buying momentum. If bulls are able to keep demand in check and negate sellers’ authority, then, DOGE might resist losing the $0.06 key support level.
Meanwhile, Dogecoin’s Open Interest (OI) has been falling, according to data for Coinalayse. Typically, the Open Interest is a dynamic indicator that shows new open positions and closed ones.
If the Open Interest is high, it means that the volume in the derivatives market is increasing. But with DOGE, the decrease implies less market activity and declining liquidity.
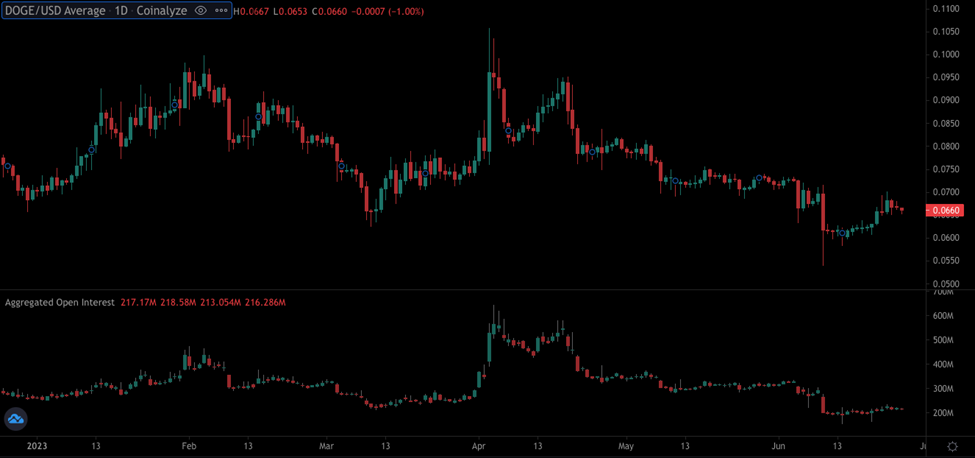
On that account, DOGE’s short-term movement might still end up consolidating. However, the chances of dropping below $0.06 seem low. Unless a widespread capitulation hits the market, the coin might remain above to the aforementioned value.
Disclaimer: The views, opinions, and information shared in this price prediction are published in good faith. Readers must do their research and due diligence. Any action taken by the reader is strictly at their own risk. Coin Edition and its affiliates will not be liable for direct or indirect damage or loss
Disclaimer: The information presented in this article is for informational and educational purposes only. The article does not constitute financial advice or advice of any kind. Coin Edition is not responsible for any losses incurred as a result of the utilization of content, products, or services mentioned. Readers are advised to exercise caution before taking any action related to the company.


