
- Price hikes by 0.32% in ADA.
- Will there be a trend reversal?
- Resistance is $0.3744 for ADA.
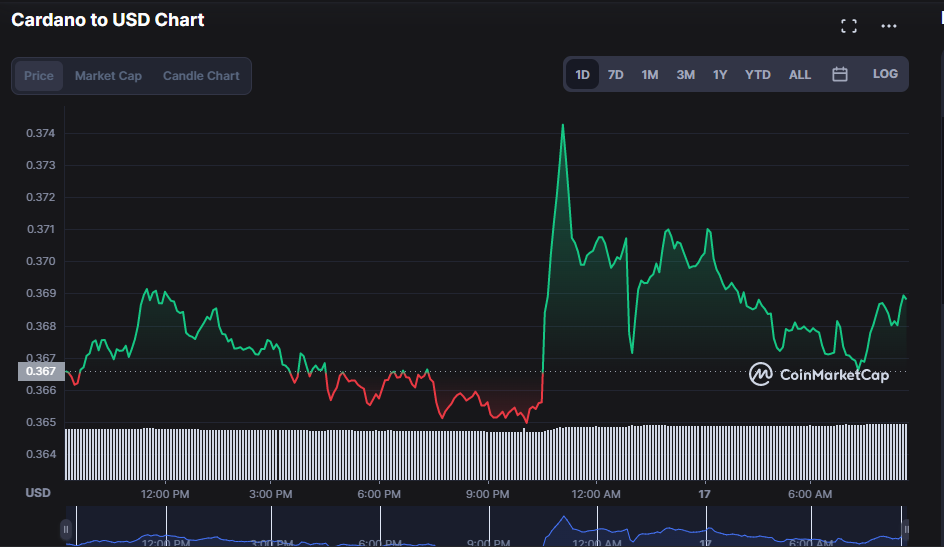
According to the price analysis of the daily price chart, Cardano (ADA) has recently been in a definite upward trend. The bulls consistently led and controlled the market from the price’s low of $0.365 to its most recent high.
At the time of publication, Cardano (ADA) was trading up 0.55% against the US dollar and was valued at $0.3683.
Both the market capitalization and trading volume increased, with the market capitalization rising to $12,647,097,391—a 0.64% increase—and the trading volume rising to $352,115,538—a 9.75% increase.
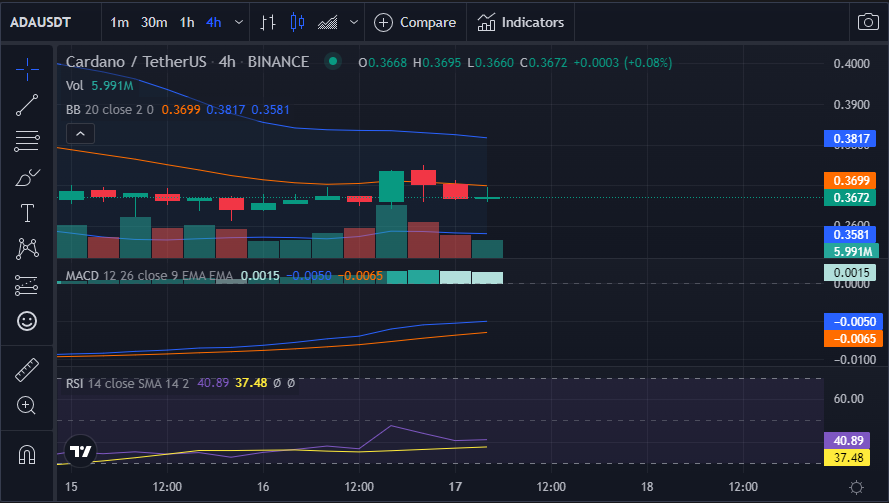
The upward trend in the price of ADA may continue if the bulls continue to outweigh the bears, according to technical indicators on the 4-hour and daily price charts.
The widening of the Bollinger Bands indicates an increase in market volatility. More market volatility signifies more pressure on the market to buy because it indicates the end of the current trend.
The upper and lower bands contact at 0.3817 and 0.3581, respectively. A rising momentum may continue as the market rises toward the upper band.
On the 4-hour price chart, the blue MACD line crosses above the signal line to indicate a positive momentum. The MACD line is in the negative region, reading -0.0050, and this may act as a warning to traders because the price movement could go either way.
The Relative Strength Index (RSI), pointing north, stands at 40.89. Since it is neither in the overbought zone nor the oversold zone, the movement is getting close to the 50 index, which denotes a healthy market. This suggests that the positive trend may be optimistic.
On the 4-hour price chart, the 20-day Moving Average has adversely crossed below the 5-day Moving Average, indicating a bearish crossover. This means that despite the ADA market being bullish, the trend may soon change, and the bears may take control of the market.
The Stoch RSI shows a negative momentum at 62.70 and is pointing south. In recent hours, Stoch RSI reached the overbought area, and it has been falling. If the bulls don’t fight and maintain the prices steady, this could be a warning that the prices will revert lower.
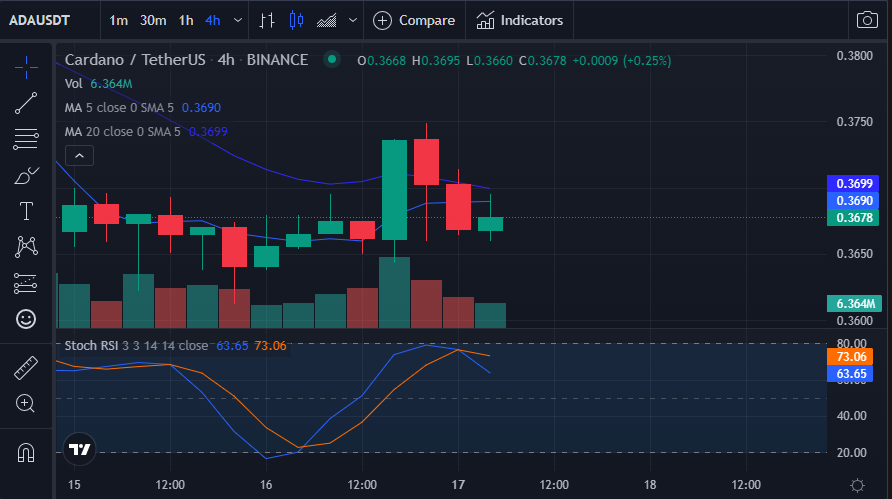
The bulls must hold the resistance level to prevent the bears from capturing the market to preserve the present market’s upward trend.
Disclaimer: The views and opinions, as well as all the information shared in this price analysis, are published in good faith. Readers must do their own research and due diligence. Any action taken by the reader is strictly at their own risk, Coin Edition and its affiliates will not be held liable for any direct or indirect damage or loss.
Disclaimer: The information presented in this article is for informational and educational purposes only. The article does not constitute financial advice or advice of any kind. Coin Edition is not responsible for any losses incurred as a result of the utilization of content, products, or services mentioned. Readers are advised to exercise caution before taking any action related to the company.
 Price Prediction: UNI Eyes $5 as UNI Extends Bullish Breakout")


