


- ARB displays solid bullish momentum but may experience a possible pullback soon.
- The token’s weak bullish momentum and low buying demand may shift the trend.
- Investors should consider risk management strategies as the Coppock Curve suggests a potential peak.
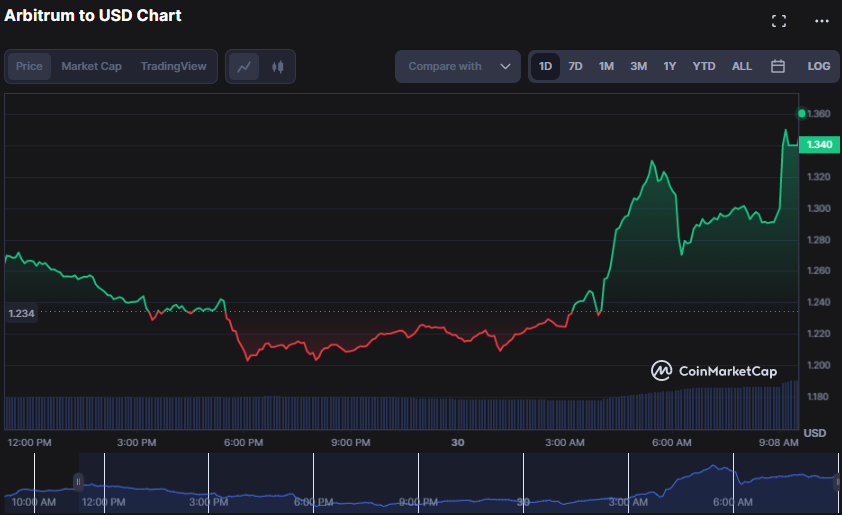
The Arbitrum (ARB) market began the day with bullish domination before seeing a short-term reversal that decreased the price to a 24-hour low of $1.20. Conversely, Bulls brushed the negative momentum under the rug after the support level at $1.20 was reached, propelling the ARB price to a 24-hour high of $1.36.
If the bulls maintain control and the resistance at $1.36 is broken, the potential resistance levels to monitor are around $1.40 and $1.45, but if the bears retake control, the support levels to watch are at $1.30 and $1.25. At press time, ARB was worth $1.34, up 7.05% from its previous close, displaying solid bullish momentum.
The market capitalization and 24-hour trading volume increased by 6.80% and 62.27%, to $1,710,838,510 and $1,339,229,852, respectively. This rise, linked to the expectation of releasing more than 1.6 million ARB tokens, may strengthen the bond between Arbitrum and Stargate.
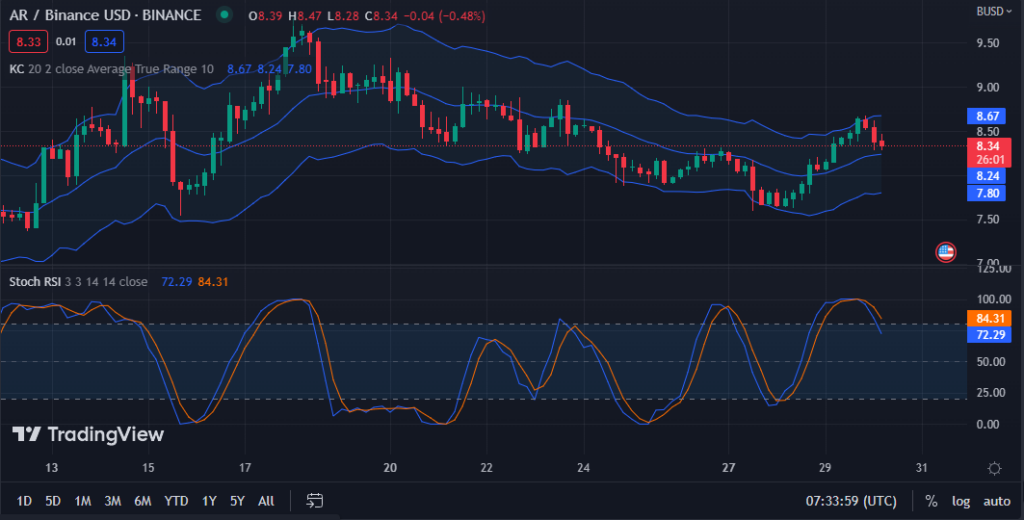
In the ARB/USD price chart, the Keltner Channel bands are rising, with the upper bar at 8.67 and the bottom at 7.80. This KC movement indicates that the bullish trend in the ARB market is gathering strength, and the price may continue to increase inside the upper and lower Keltner Channel bands.
Nevertheless, the formation of red candlesticks and the movement of price action from the top bar toward the middle band imply that a pullback is possible soon, and traders should watch the support levels to assess if the trend will continue or reverse.
With a score of 72.29, the Stochastic RSI movement south and below its signal line implies that ARB bullishness is fading. Traders may consider taking profits or executing a stop-loss plan to safeguard their gains in the event of a trend reversal.
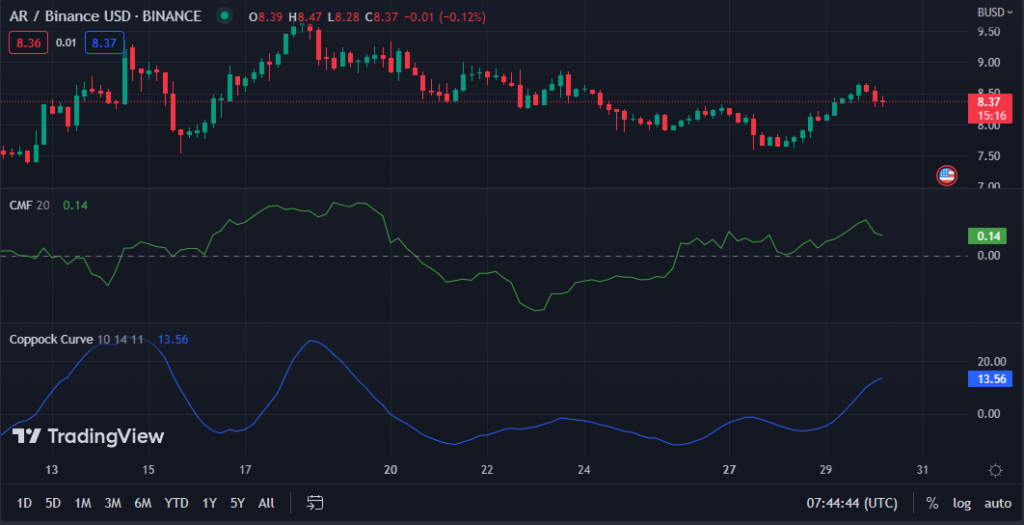
The Chaikin Money Flow level of 0.15 indicates that ARB’s bullish momentum is weak and that there is little buying demand to propel the price. This level might suggest that the trend will shift or the price will remain stable soon.
But, because it is heading south, it signals that a negative trend may be on the way, signaling a probable price decrease or a move in market sentiment toward selling.
With a Coppock Curve reading of 13.56, the bullish trend may have already reached its peak, and investors should consider taking profits or implementing risk management strategies to protect their investments.
As ARB/USD price rises, bulls aim for $1.40 and $1.45 resistance levels, but traders should exercise caution as indicators show potential for a trend reversal.
Disclaimer: The views, opinions, and information shared in this price prediction are published in good faith. Readers must do their research and due diligence. Any action taken by the reader is strictly at their own risk. Coin Edition and its affiliates will not be liable for direct or indirect damage or loss.
Disclaimer: The information presented in this article is for informational and educational purposes only. The article does not constitute financial advice or advice of any kind. Coin Edition is not responsible for any losses incurred as a result of the utilization of content, products, or services mentioned. Readers are advised to exercise caution before taking any action related to the company.


