


- Aptos has been on a bearish trend for two consecutive days.
- Bears biting past $3.1 could take APT to further drops.
- Bulls on the four-hour chart have rekindled trying to correct the negative trend.
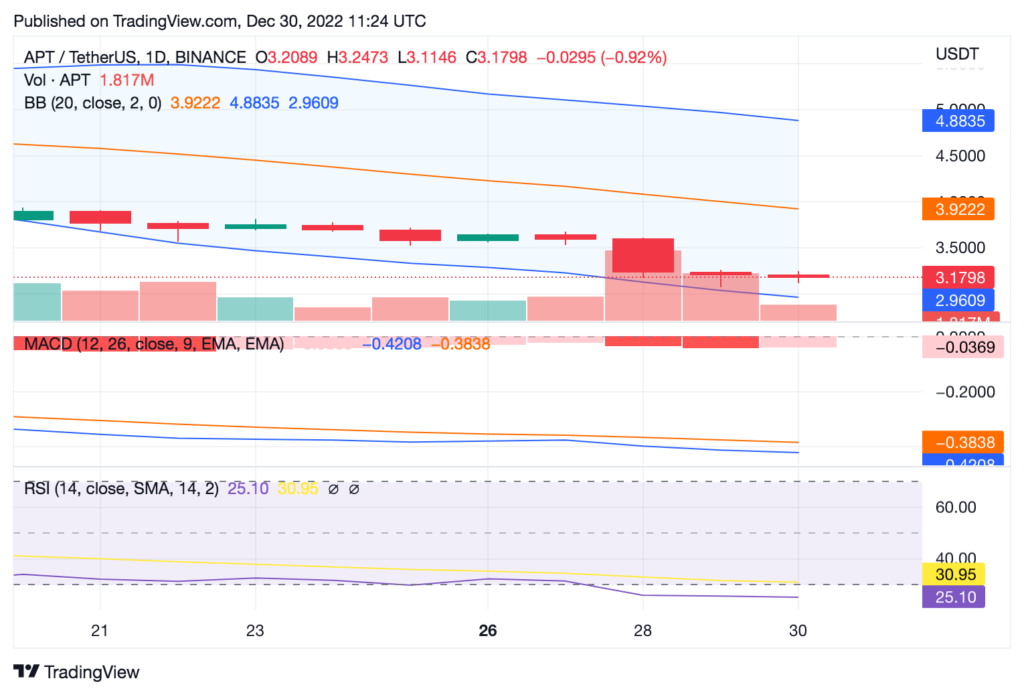
Apto’s (APT) price has been falling since yesterday, and bears are currently in control of the APT market. The bear market intervention altered the direction of the APT price trend. APT found support at $3.58 and resistance at $3.922 when the bears took control of the market.
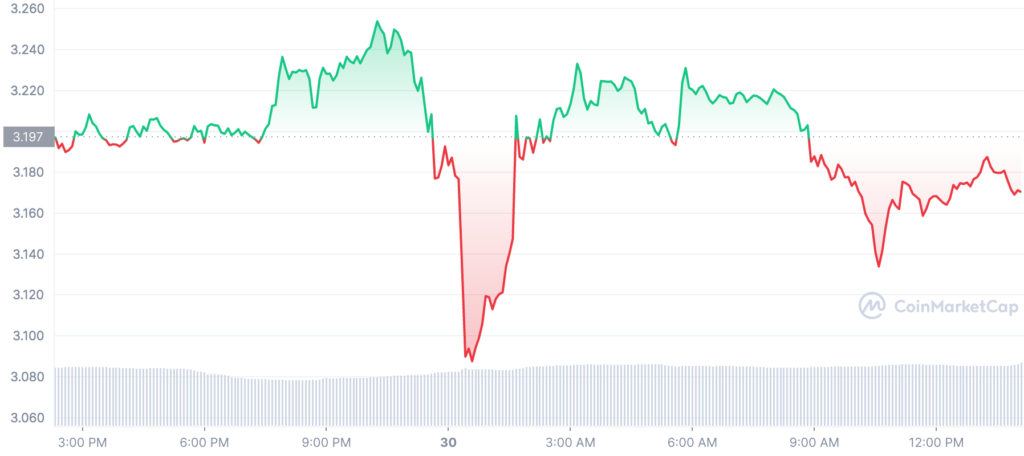
The price of APT has decreased by 0.35% over the past day and is now trading at $3.18. The market capitalization has declined by 0.40% to $413,362,301. The trade volume, on the other hand, increased 5.18% to $66,204,213, indicating a negative outlook.
The upper and lower bands of the Bollinger Bands touched 3.0876 and 3.259, respectively, indicating an increase in selling pressure in the APT market. This downward trend is supported by the bearish engulfing candlestick pattern.
APT began trading at an intraday low of $3.18, per the price analysis of the daily chart and has since sunk sideways, forming a descending triangle pattern. The 200 and 100 SMA curves are holding the price steady, pointing to a long-term negative trend.
The histogram’s position in the negative region is another element bolstering this bearish trend. This motion supports the idea that the bear trend in the APT market will last for some time.
Prices have been progressively sliding into the lower band, which indicates that bear vigor will likely prevail and is another sign that the current market pattern may continue.
According to the Relative Strength Index (RSI) line, which is currently at 25.10, the market’s current bearish trend may continue. Investors are worried about the likelihood of a bearish persistence because the most recent dip below its SMA line is extending the current negative trend.
The 9-day and 20-day EMA lines, as well as the daily RSI indicator, all showed negative indications at the time of publication. The daily RSI line has crossed below the daily RSI SMA line and is currently sloping down towards the oversold area. Currently, the 20-day EMA line is higher than the 9-day EMA line. These two indicators suggest that Aptos’ charts are under a strong bearish influence.
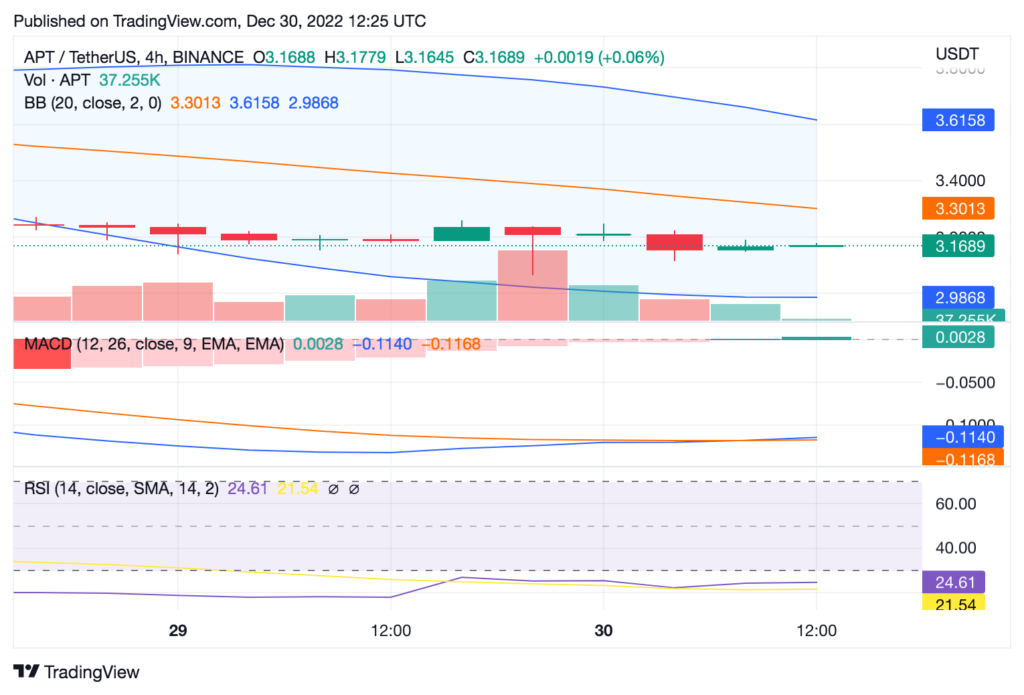
The bulls have started to show positive signs of a market reversal to a bullish trend on the four-hour chart. They have pushed the price up to $3.16 in the near term and would make APT surge past the current resistance level at $3.2071.
Disclaimer: The views and opinions, as well as all the information shared in this price analysis, are published in good faith. Readers must do their own research and due diligence. Any action taken by the reader is strictly at their own risk, Coin Edition and its affiliates will not be held liable for any direct or indirect damage or loss.
Disclaimer: The information presented in this article is for informational and educational purposes only. The article does not constitute financial advice or advice of any kind. Coin Edition is not responsible for any losses incurred as a result of the utilization of content, products, or services mentioned. Readers are advised to exercise caution before taking any action related to the company.


 Price Prediction 2026, 2027, 2028, 2029, 2030-2050")

