
- Shiba Inu’s L2 could soon go live on Mainnet amid several collaborations.
- SHIB’s near-term price could consolidate around $0.00000773 and $0.00000793
- The short-term EMAs closed in on each other but the market structure favored the bulls.
Shiba Inu’s (SHIB) price has not neared the highs of 2021, sparking doubts about the long-term relevance of the token. However, the project has been doing all its can to improve in terms of utility. Previously, Shiba Inu was only known as a memecoin like Dogecoin (DOGE). However, since the bull market subsided, the project’s team has shifted its focus mainly from the price action.
SHIB: The Center of Utility
One development that has garnered attention in the Shiba Inu ecosystem is Shibarium. For context, Shibarium is the upcoming Layer Two (L2) network built on the Ethereum (ETH) blockchain.
While Shibarium development has passed the Testnet stage, NOWNodes, one of its development arms, announced on July 20 that the project’s Mainnet could soon be live.
Besides Shibarium, Shiba Inu has also had over 150 partnerships with different projects. This information was revealed by Shiba Archives‚— a platform tracking development on the Shiba Inu ecosystem.
Despite increasing utility and collaboration, SHIB has lost 22.25% of its value in the last 90 days. But the SHIB/USD 4-hour chart, the decline could soon turn into a positive price action.
Low volatility and Bullish Signals
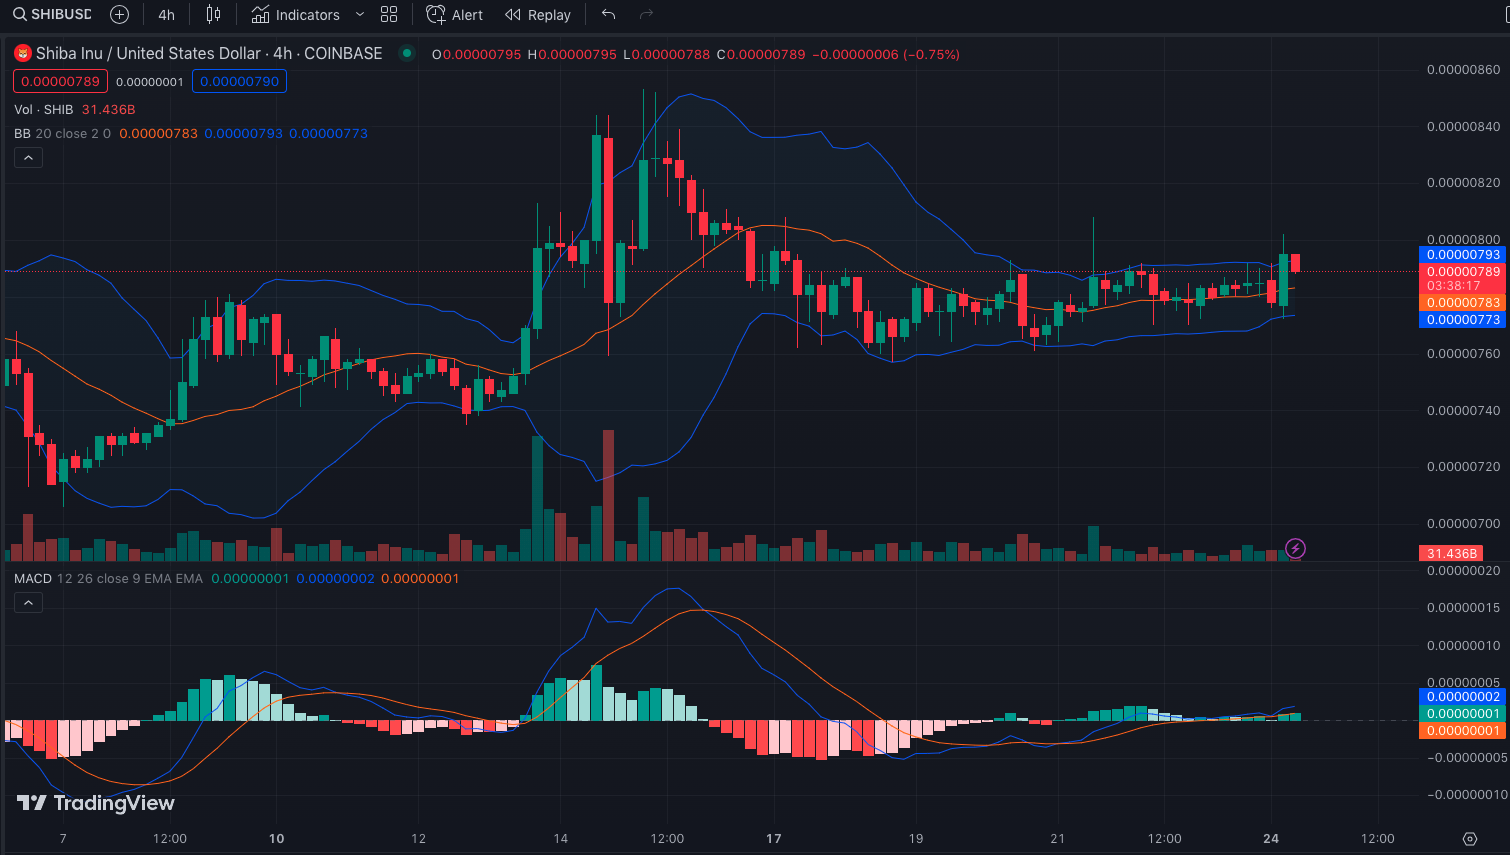
A ground for the presumption is the Moving Average Convergence Divergence (MACD). At press time, the MACD was in positive territory. This position of this indicator signals increasing upward momentum. Therefore, traders may want to refrain from taking short positions considering the appearance of a bullish divergence.
Concerning volatility, the Bollinger Bands (BB) showed that SHIB’s volatility was low. However, the lower band of the BB touched SHIB at $0.0000077. Also, the upper band touched the SHIB price at $0.0000079. In this case, SHIB could end up consolidating between $0.00000773 and $0.00000793.
Bulls Have the Upper Hand
Another reason why SHIB could consolidate within the aforementioned region is the Exponential Moving Average (EMA). At the time of writing, the 20 EMA (blue) was almost at the same spot as the 50 EMA (yellow).
If the 20 EMA finally crosses above the 50 EMA, then SHIB might confirm the bullish bias indicated by the MACD. But as it stands, the near-term trend still favored the bulls over a sharp decrease in value.
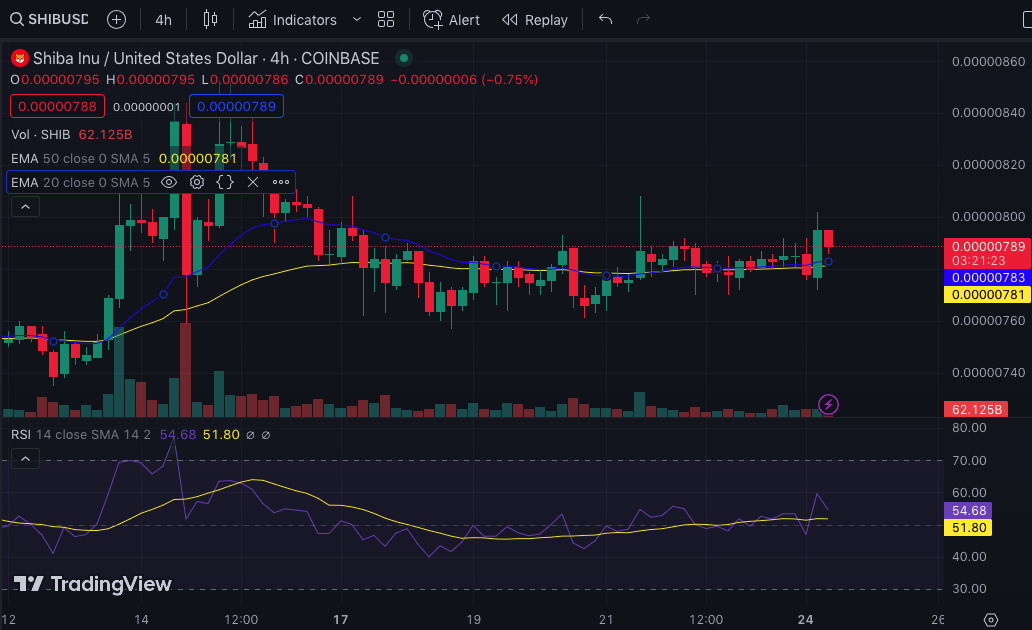
Additionally, the Relative Strength Index (RSI) had climbed to 53.93. This depicts an increase in the buying momentum. If the RSI pushes toward 60, then SHIB might close in on $0.000008. If not, consolidation could continue.
Disclaimer: The views and opinions, as well as all the information shared in this price prediction, are published in good faith. Readers must do their research and due diligence. Any action taken by the reader is strictly at their own risk. Coin Edition and its affiliates will not be held liable for any direct or indirect damage or loss.
Disclaimer: The information presented in this article is for informational and educational purposes only. The article does not constitute financial advice or advice of any kind. Coin Edition is not responsible for any losses incurred as a result of the utilization of content, products, or services mentioned. Readers are advised to exercise caution before taking any action related to the company.


