


 Price Prediction 2025, 2026, 2027, 2028-2030")
After a lengthy downtrend, XDC Network (XDC) appears to be stabilizing above its long-term demand zone. With RSI strength climbing, MACD showing bullish divergence, and price reclaiming support near the 0.786 Fibonacci zone, XDC could be positioning for a mid-cycle breakout across 2025 and beyond.
XDC Network’s Price Trajectory 2025-2030
XDC Network (XDC) Price Prediction 2025
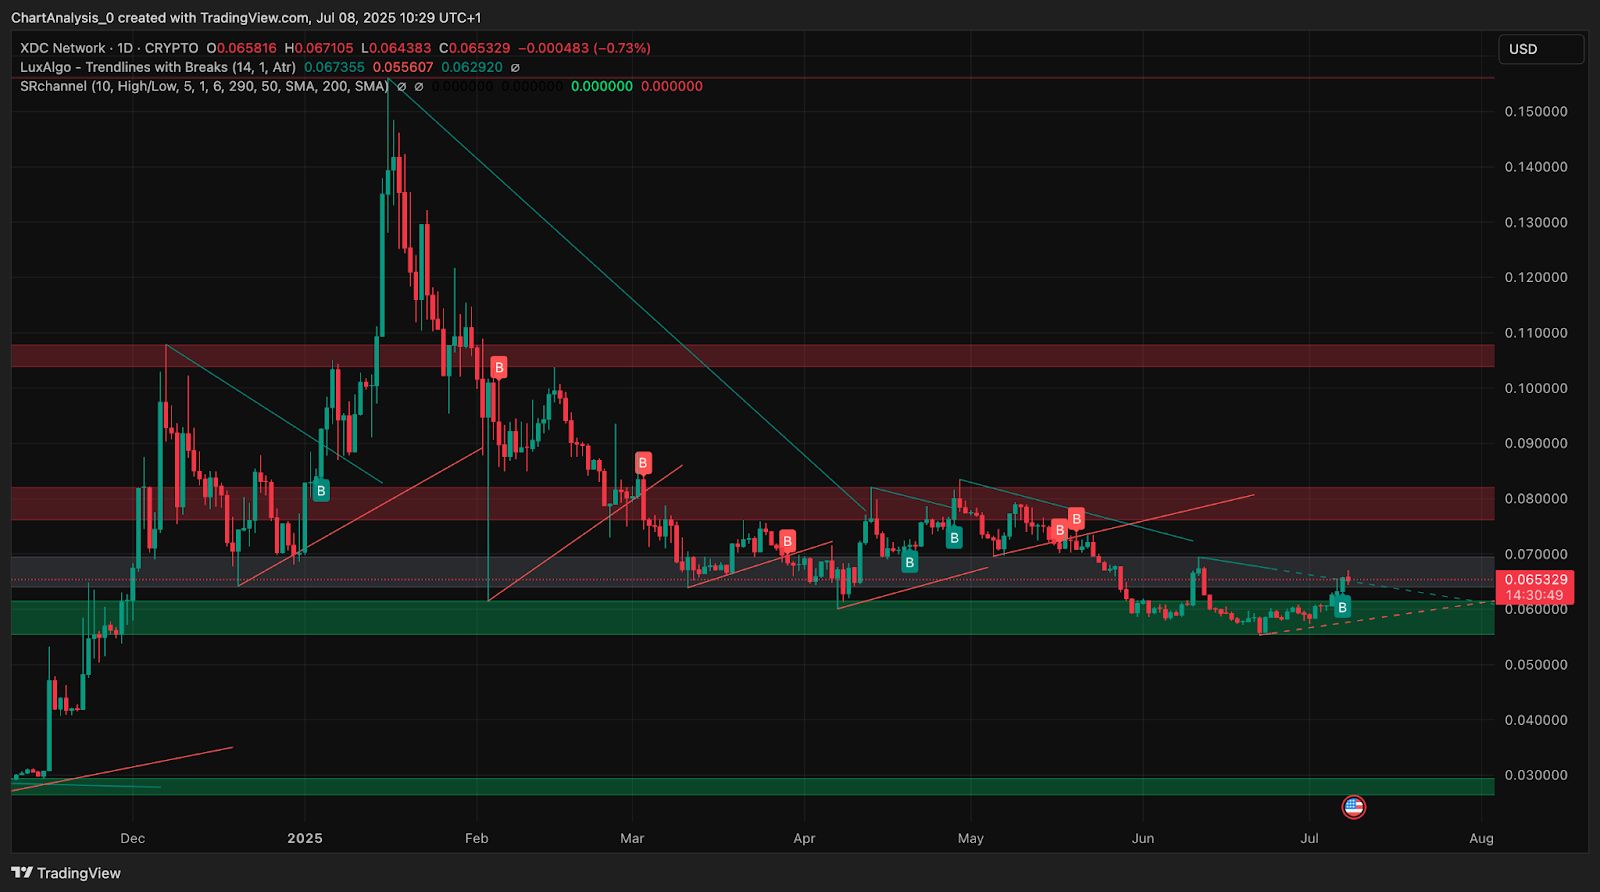
The XDC price today trades around $0.0653 after bouncing from key support near $0.053. The daily chart reveals an ascending triangle structure, with the price attempting to break above confluence resistance between $0.066 and $0.070. A clean move above the $0.070 threshold could trigger a push toward the $0.091 Fibonacci zone (Fib 0.5), which remains a pivotal level for a macro trend reversal.
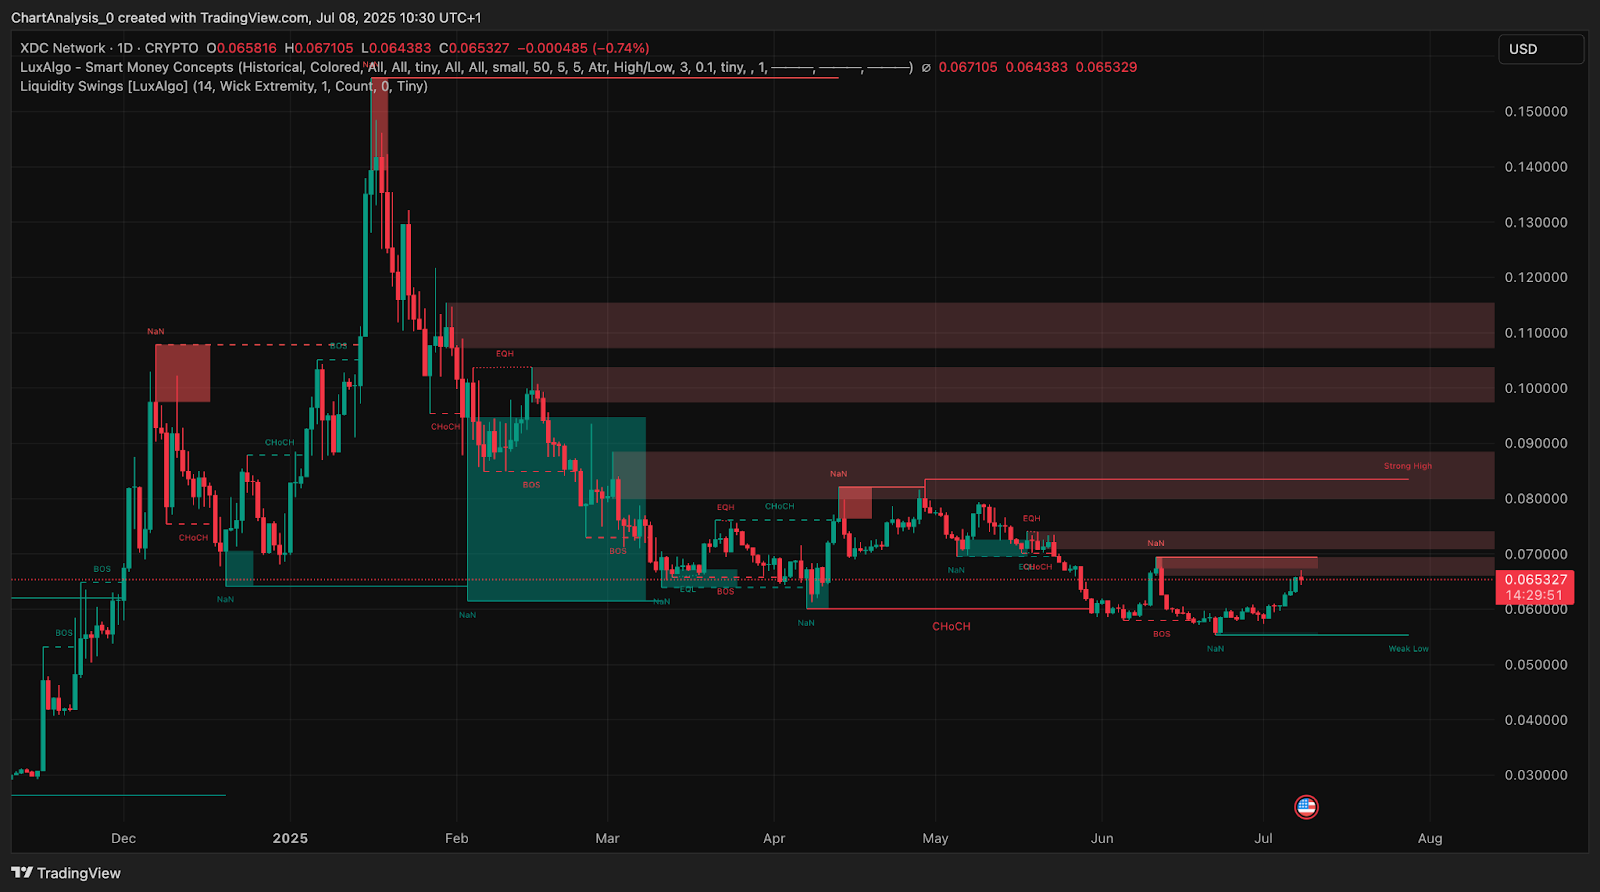
On the Smart Money Concepts (SMC) chart, a clear break of structure (BOS) has occurred, with the price now eyeing the $0.070–$0.078 liquidity zone.
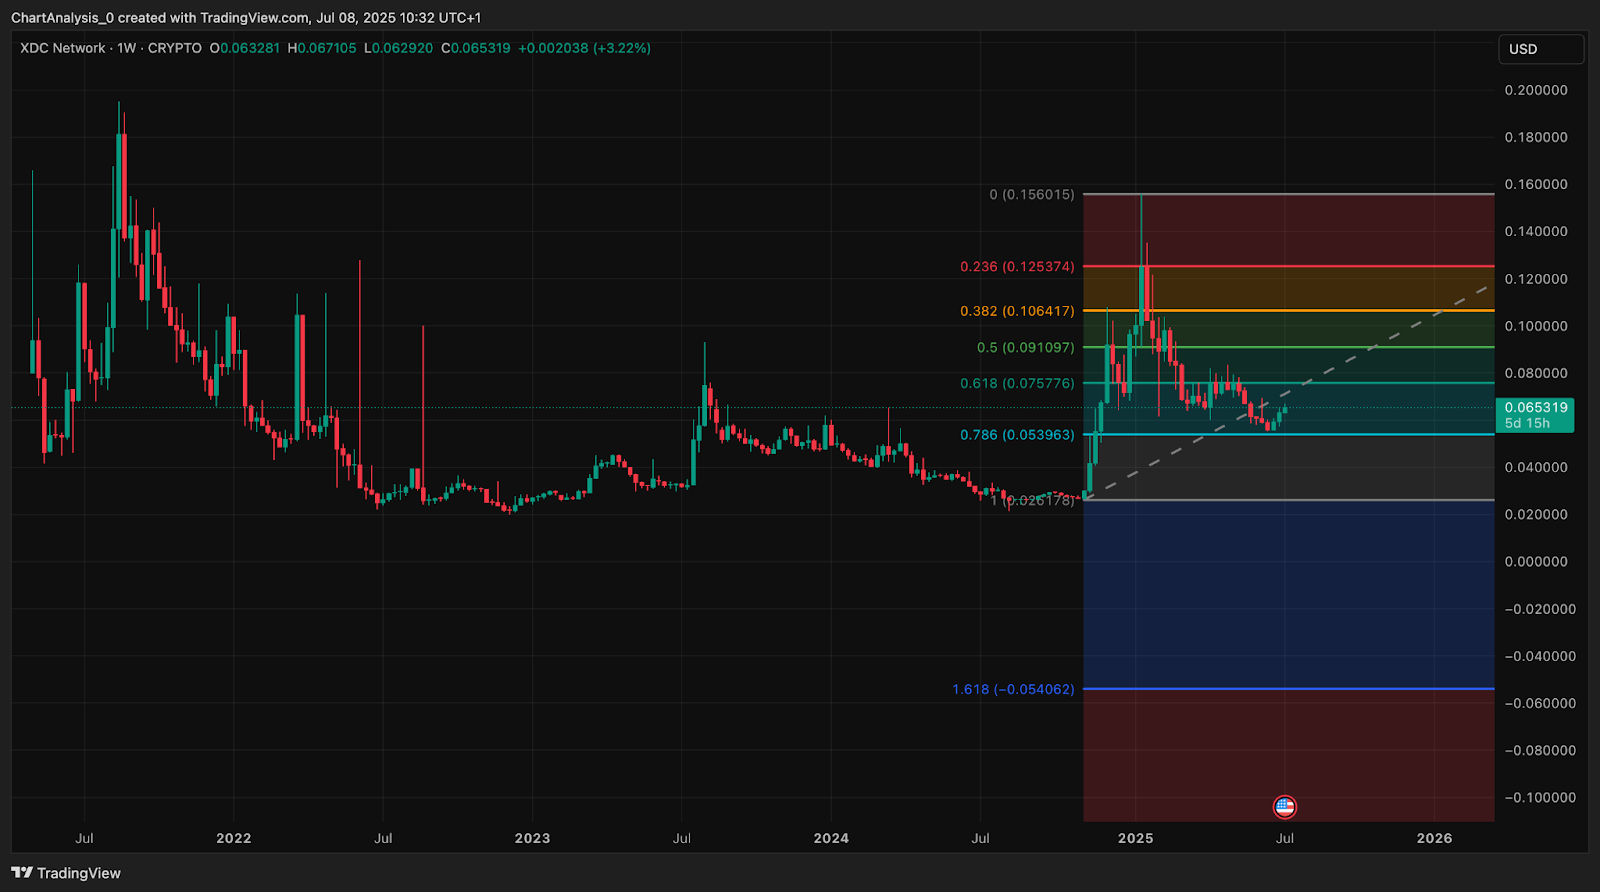
The broader weekly structure confirms XDC’s bounce from the Fib 0.786 level at $0.0539. A sustained push through $0.075–$0.091 would indicate a bullish shift targeting long-term highs near $0.106 and $0.125. However, failure to reclaim $0.070 could reintroduce selling pressure toward the $0.053–$0.050 demand block.
XDC Price Indicators, Signals, Graphs and Charts (1y)
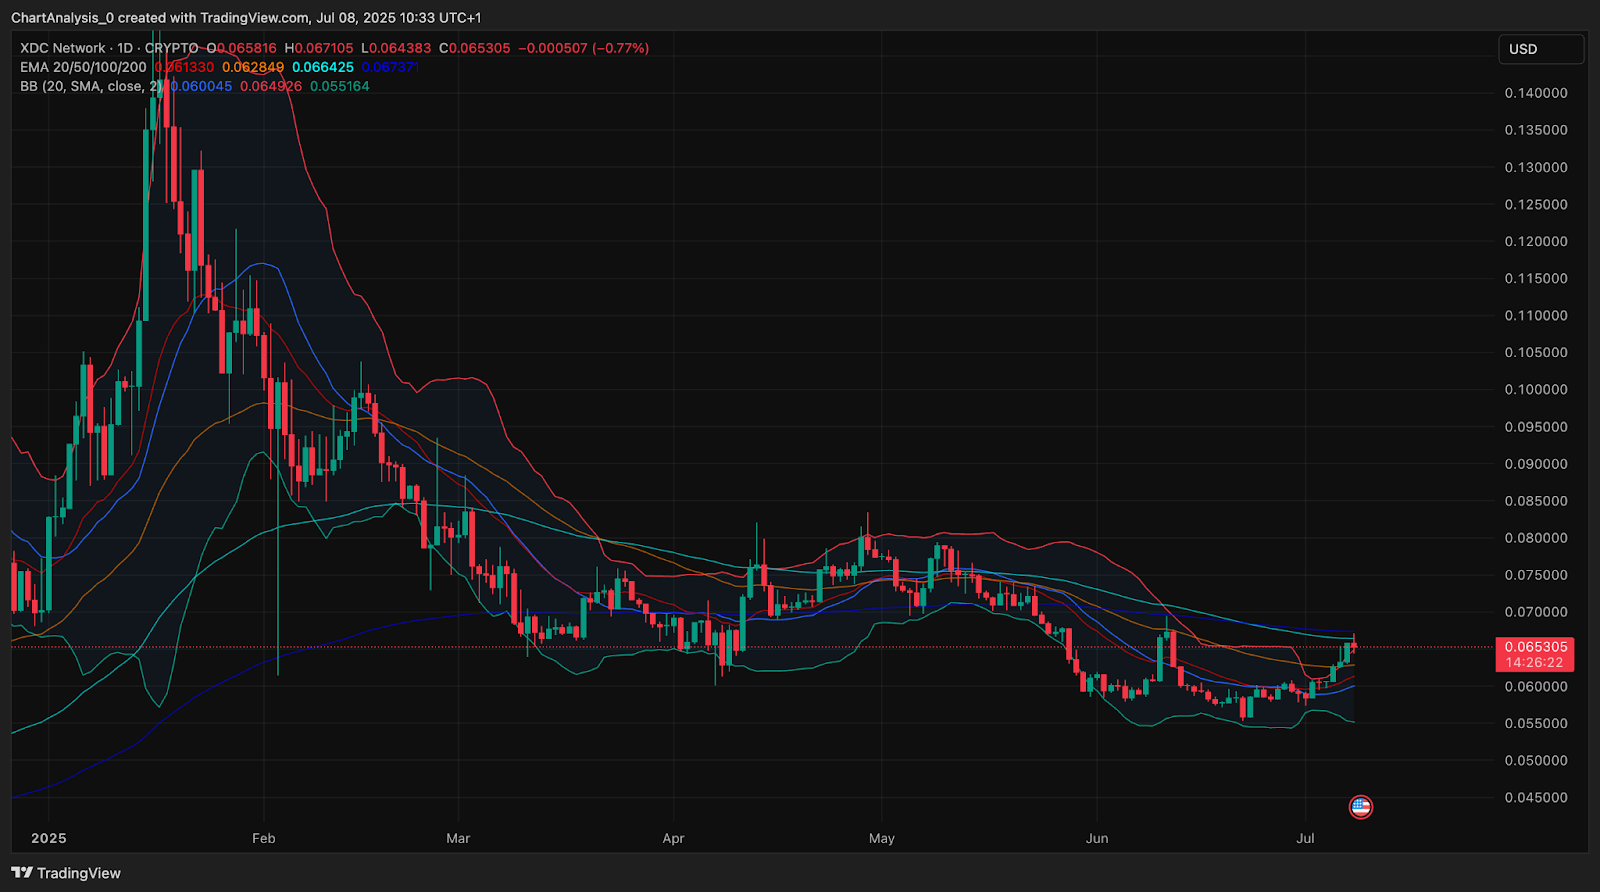
The EMA cluster shows XDC reclaiming the 20 and 50 EMAs, with price now testing the 100 EMA at $0.0664. The 200 EMA sits higher at $0.076 and acts as the final resistance barrier for a full trend reversal. A sustained breakout above this level could confirm a bullish macro shift.
Bollinger Bands are beginning to expand after a prolonged squeeze, indicating rising volatility. The price is testing the upper band near $0.0673, hinting at bullish continuation if momentum persists.
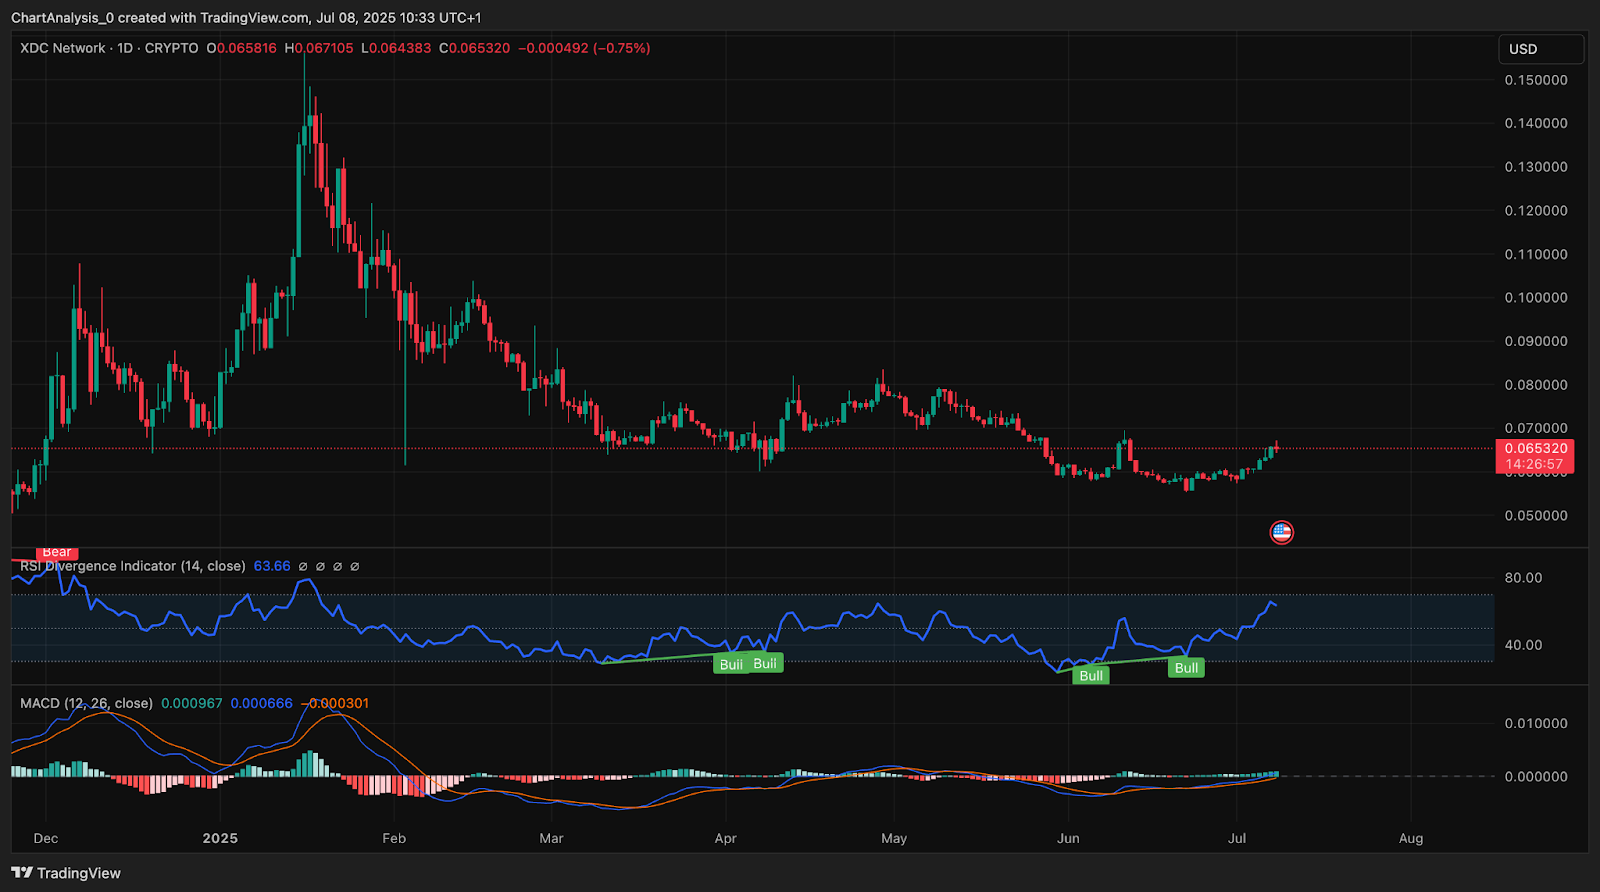
The RSI (14) currently reads above 63, marking a steady upward push out of the neutral zone. This supports growing buyer strength, especially as it rises alongside price structure.
On the MACD, a bullish crossover has formed with a strengthening histogram, suggesting a recovery phase is in progress. This signal aligns with higher lows forming on the price chart.
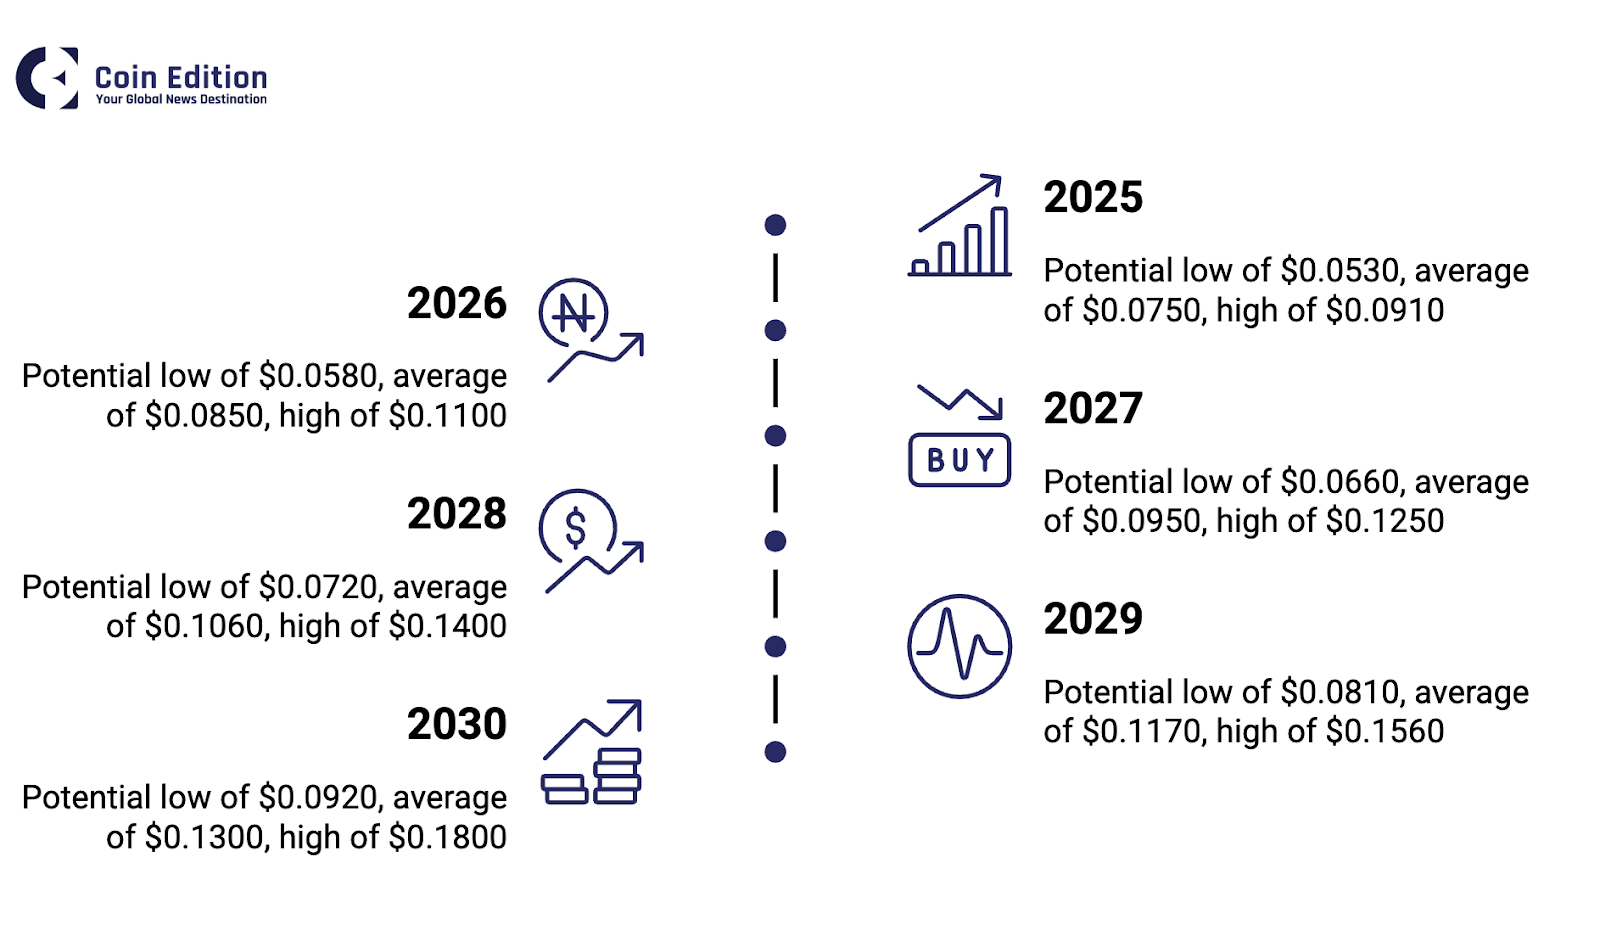
XDC Network (XDC) Price Targets 2025–2030
| Year | Potential Low ($) | Potential Average ($) | Potential High ($) |
| 2025 | 0.0530 | 0.0750 | 0.0910 |
| 2026 | 0.0580 | 0.0850 | 0.1100 |
| 2027 | 0.0660 | 0.0950 | 0.1250 |
| 2028 | 0.0720 | 0.1060 | 0.1400 |
| 2029 | 0.0810 | 0.1170 | 0.1560 |
| 2030 | 0.0920 | 0.1300 | 0.1800 |
XDC Network (XDC) Price Prediction 2026
In 2026, XDC may benefit from network expansion and increased developer activity within the trade finance space. A decisive breakout above $0.091 could open the path toward the 0.382 Fibonacci level near $0.106. If macro tailwinds align with protocol adoption, XDC may average near $0.085, with a high near $0.110 likely. Support around $0.058 should hold during pullbacks.
XDC Network (XDC) Price Prediction 2027
By 2027, XDC could target higher Fibonacci levels if broader market sentiment remains bullish. The $0.125 area may be reached if the price sustains above $0.091 and attracts institutional interest. A breakout pattern resembling a long-term cup and handle may materialize, placing $0.066 as a key bullish defense.
XDC Network (XDC) Price Prediction 2028
With potential onboarding of traditional finance players and cross-border integrations, XDC could rally to the $0.140 mark in 2028. The average could remain around $0.106, assuming support holds above $0.072. Continued SMC-based bullish structure and expanding volume could aid price discovery.
XDC Network (XDC) Price Prediction 2029
If historical halving cycles influence crypto broadly, 2029 may serve as a euphoric phase. XDC could revisit previous highs near $0.156, with macro structures and liquidity sweeps playing a major role. Weekly trendline continuation from 2025–2027 could support an average near $0.117, with downside capped at $0.081.
XDC Network (XDC) Price Prediction 2030
By 2030, if the XDC Network sustains developer momentum, enhances token utility, and strengthens enterprise partnerships, the price could climb toward $0.180. The average may rest near $0.130, while a strong support range could build between $0.092 and $0.100, allowing for long-term consolidation before the next macro phase.
Conclusion
XDC Network’s price outlook through 2030 reflects a maturing base structure with bullish signals across multiple indicators. With the asset reclaiming technical levels and forming structural breakouts, long-term potential hinges on sustained ecosystem progress, broader market cycles, and key breakouts above $0.091. As long as the $0.053–$0.058 support zone holds, bulls may continue to build momentum for a gradual multi-year climb.
Disclaimer: The information presented in this article is for informational and educational purposes only. The article does not constitute financial advice or advice of any kind. Coin Edition is not responsible for any losses incurred as a result of the utilization of content, products, or services mentioned. Readers are advised to exercise caution before taking any action related to the company.


 Price Prediction 2026, 2027, 2028, 2029, 2030-2050")

