


- Franklin Templeton adopts Stellar blockchain technology for transaction activity.
- However, XLM, the native token of the Stellar blockchain, faced an 11.91% fall in one week.
- Indicators signal that XLM would continue to face the bears’ attack for some time.
Franklin Templeton, an investment management company, announced that the Franklin OnChain U.S. Government Money Fund has surpassed $270 million in assets under management (AUM). According to Stellar’s press release, the Fund’s official record of share ownership is maintained via a blockchain-integrated system that utilizes the Stellar blockchain technology for transaction activity.
Stellar also highlighted that the Franklin OnChain U.S. Government Money Fund is the first US-registered mutual fund to process transactions and record share ownership on public blockchain technology. Moreover, Stellar pointed out that the Fund can be accessed through the Benji Investments app.
Commenting on this achievement, the Head of Digital Assets at Franklin Templeton expressed:
We believe that blockchain technologies have the potential to reshape the investment management industry by providing greater transparency and lower operational costs for traditional financial products.
With this announcement, the crypto community believes that this is just another feather in the hat for Stellar. As more upcoming projects continue to utilize Stellar, this could be one of the factors among many that could drive the price upwards.
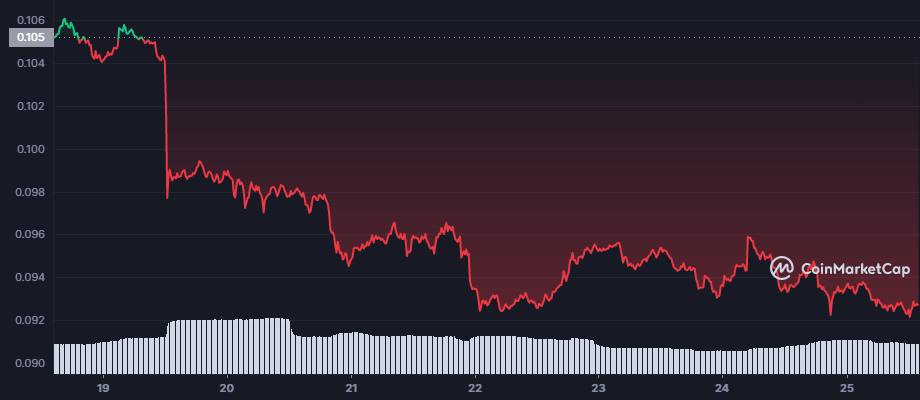
However, XLM, the native token of the Stellar blockchain, faced a 11.91% fall in one week. XLM is currently priced at $0.09266, after tumbling by 1.11% in 24 hours. Similar to many altcoins, XLM could be experiencing a bearish sentiment as it is residing in the red zone.
Moving on to the charts, the RSI indicator shows that XLM is facing a weak trend, as it is between the values of 50 and 30. The RSI, valued at 37.89, crossed below the SMA. However, the RSI is pointed upwards, indicating that a trend reversal may happen soon. If the RSI continues to move upwards, then, XLM could experience a bullish sentiment over time, thus, reaching the Resistance level.
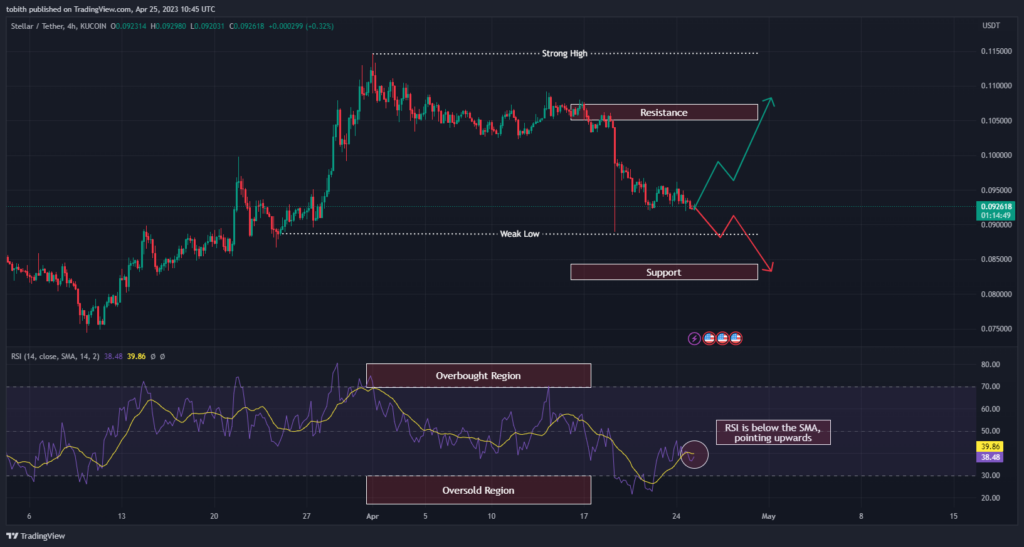
However, if the RSI reverses and continues to move downwards, XLM could reach the oversold region. This could make XLM plummet to the Weak Low region at $0.08859. Moreover, if RSI continues to reside in the oversold region, then, XLM could further tumble to the Support region.
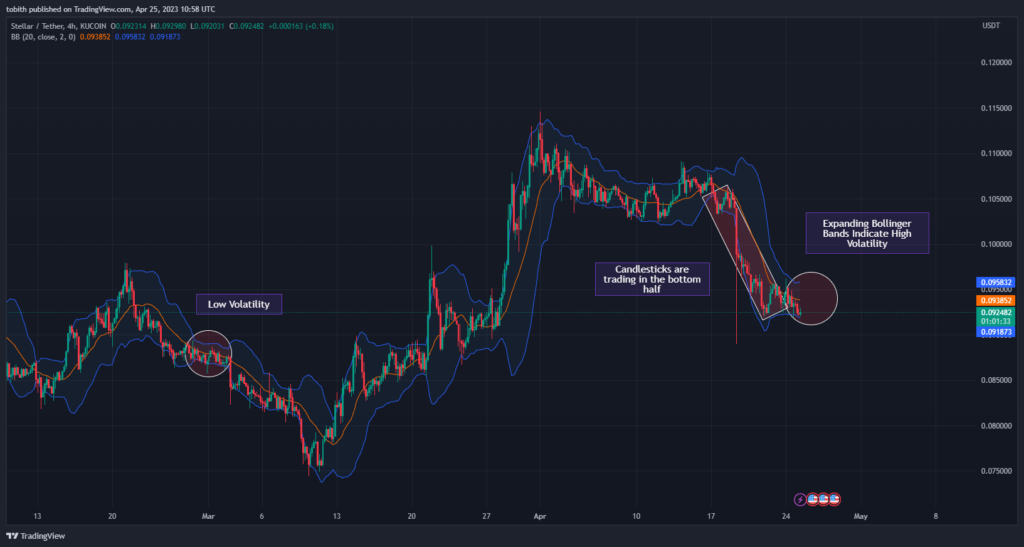
The Bollinger Bands also confirm that XLM is currently facing a weak trend, as it is trading in the bottom half of the indicator. Moreover, there is a possibility that XLM could experience a trend reversal as the bands are expanding, which is considered as a sign of high volatility. If XLM experiences a trend reversal, the candlesticks will be trading in the top half of the Bollinger Bands.
Ultimately, traders should closely observe XLM’s price movement as indicators shows signs that the altcoin could experience bullish sentiment.
Disclaimer: The views and opinions, as well as all the information shared in this price analysis, are published in good faith. Readers must do their own research and due diligence. Any action taken by the reader is strictly at their own risk, Coin Edition and its affiliates will not be held liable for any direct or indirect damage or loss.
Disclaimer: The information presented in this article is for informational and educational purposes only. The article does not constitute financial advice or advice of any kind. Coin Edition is not responsible for any losses incurred as a result of the utilization of content, products, or services mentioned. Readers are advised to exercise caution before taking any action related to the company.


