


- XLM has caught the attention of the crypto community with its double-digit spike over the week.
- The altcoin experienced a surge of 15.07% while its market cap is valued at $3,958,550,836.
- A recent red candlestick could be a sign of either price retracement or a minor setback.
XLM has caught the attention of the crypto community with its double-digit spike over the week. After experiencing a major spike earlier this month, Stellar’s native token started off this week in the red zone. However, it gradually rose in the first three days of the week, thus, entering the green zone of the chart. Subsequently, the altcoin also fell straight downwards on Thursday but quickly recovered on the same day. XLM continues to trade in the green zone at a price of $0.1456.
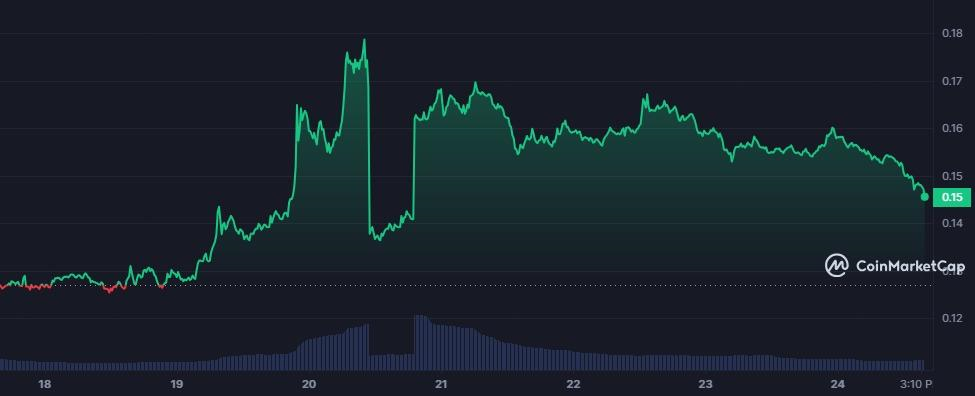
XLM currently holds the 21 position, just below LINK. Over the seven-day period, the altcoin experienced a surge of 15.07% while its market cap is valued at $3,958,550,836. With a circulating supply of 27,222,888,444 XLM, the trading volume is valued at $200,717,377 after witnessing a fall of 16.07%.
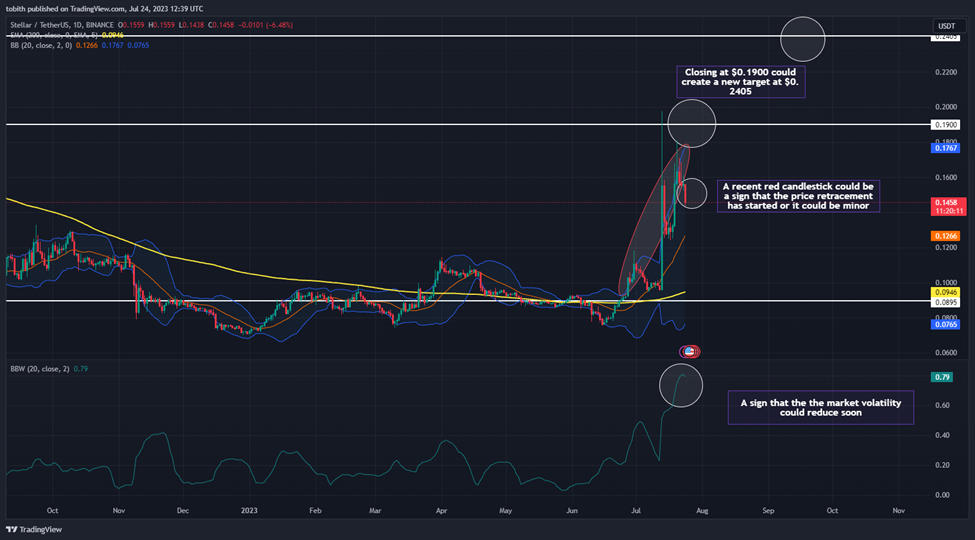
Looking at the daily chart, XLM’s double-digit spike enabled the candlesticks to break through the upper Bollinger Band. The candlesticks breaking out beyond the upper band could be a sign of an overbought market condition, thus, price retracement may happen soon. Since a new red candlestick was formed recently, there is a chance that the price retracement may have begun already.
However, the new red candlestick could also be a minor setback, hence, XLM may rise once again. During the uptrend movement, the candlesticks need to close at $0.1900 before it reaches the $0.2405 resistance level, which is the second targetted resistance level for the altcoin.
The candlesticks need to reach the first resistance level soon as there are signs that the market volatility may reduce after some time. For instance, as the BBW indicator is pointed downwards, the Bollinger Bands may contract. Therefore, traders need to watch out for signals before entering the market as the candlesticks may trade sideways during a low volatile period.
Disclaimer: The views and opinions, as well as all the information shared in this price analysis, are published in good faith. Readers must do their own research and due diligence. Any action taken by the reader is strictly at their own risk, Coin Edition and its affiliates will not be held liable for any direct or indirect damage or loss.
Disclaimer: The information presented in this article is for informational and educational purposes only. The article does not constitute financial advice or advice of any kind. Coin Edition is not responsible for any losses incurred as a result of the utilization of content, products, or services mentioned. Readers are advised to exercise caution before taking any action related to the company.


