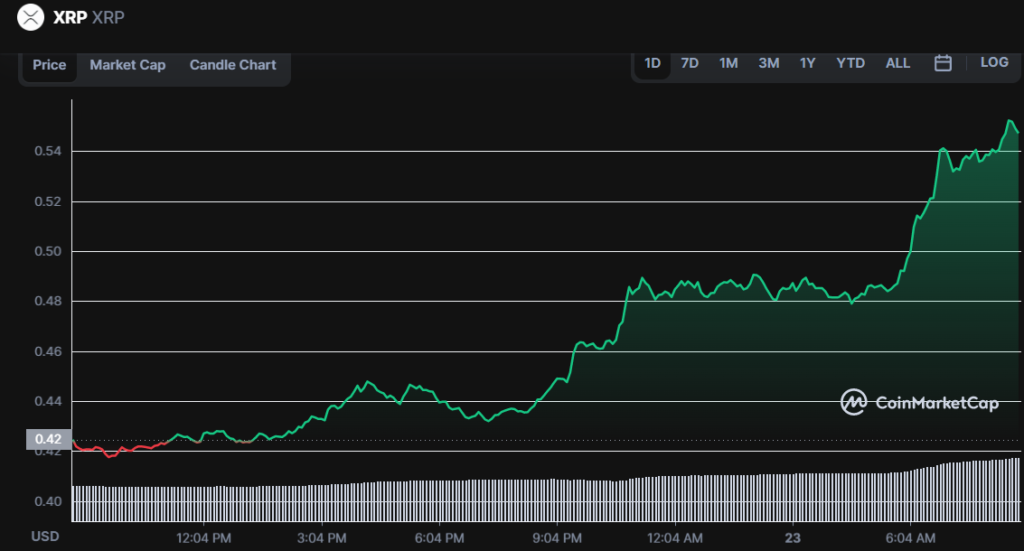
- Ripple prices surged by 30% in the last 24 hours.
- XRP/BTC active whales are on the move.
- The recent price action has seen the XRP/BTC pair attain a one-year high.
The ripple price analysis finds Ripple (XRP) whales activity has picked up in the past few days, with a number of large transfers being made between wallets. This activity comes as the price of XRP surged by over 30% in the last 24 hours, hitting a one-year high of $0.5518.

The recent price surge has been attributed to the potential settlement of Ripple with the SEC, and this raises the optimism that XRP will continue surging in price.
The XRP/BTC pair has hit a one-year high of $0.5518 amidst a broad-based market rally that has seen the most significant cryptocurrencies posting gains.
Notably, this pair has surged by over 56% in the past 7 days, hitting a one-year high of $0.5518. XRP’s current price is currently above all the moving average lines, which is a bullish sign.
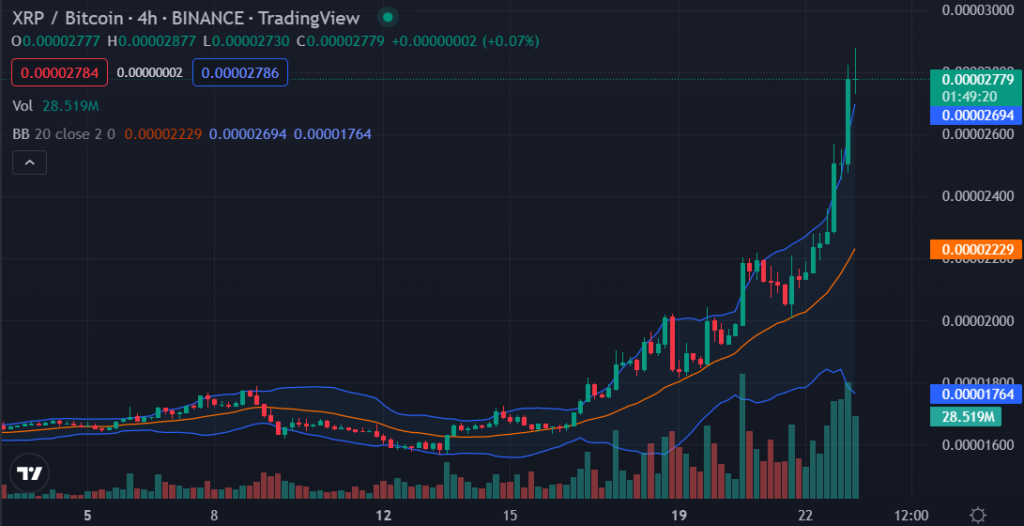
Moreover, the XRP market volatility is significantly high due to the current buying action in the market. The Bollinger bands are bulging outwards, an indication that the market is poised to break higher in the near term. For instance, the upper band is touching $0.6000, which is the next key resistance level.

The stochastic indicator is in the overbought region but still maintains an upward trend. This suggests that there is bullish momentum in the market and that the current rally could continue in the near term.
Looking at the daily chart, we can see that Ripple (XRP) has formed a cup and handle pattern. This is a bullish reversal pattern that is usually seen at the end of a downtrend.

The cup and handle pattern has an upside target of $0.7000, which is the next key resistance level. The current rally could continue in the near term as long as the price remains above the $0.4800 support level.
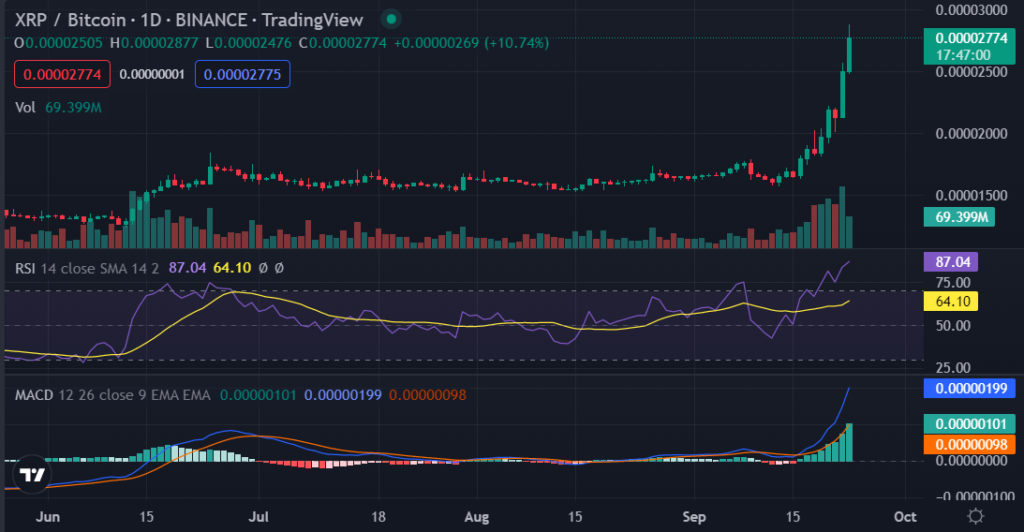
XRP currently has a trading volume of $6.364 billion, while the market cap is currently at $26.9 billion. With a total supply of $54.01 billion, XRP currently has a market dominance of 2.83%. The MACD indicator is in positive territory, indicating that the bulls have the upper hand.
The RSI indicator is also in the overbought zone, which suggests that the price might consolidate in the short term before making another attempt to move higher. The RSI is currently at 85 and is significantly above the 50 level, which is a bullish sign.
On the downside, major support levels are at $0.5000, $0.4800, and $0.4600. Clear green candlesticks on the XRP/BTC 4-hour chart indicate that the bulls are in control of the market. The bulls will be expected to hold the XRP price around $0.5433 to extend the rally to $0.6000. The bears will look to take control of the market if the XRP price falls below $0.5000.
Overall, XRP seems promising in this crypto winter, and is expected to continue to rise soon, as long as the market sentiments remain positive. On the flipside, if bears come into the market, the price may retrace to the $0.4800 support level before making another attempt to move higher.
Disclaimer: The information presented in this article is for informational and educational purposes only. The article does not constitute financial advice or advice of any kind. Coin Edition is not responsible for any losses incurred as a result of the utilization of content, products, or services mentioned. Readers are advised to exercise caution before taking any action related to the company.


