


- EGRAG CRYPTO shared the results for a poll he ran on 13 December.
- He revealed that 56.3% of the 3,000 voters are frustrated with XRP’s performance.
- XRP lost a key support level after dropping 1.72% in the last 24 hours.
The cryptocurrency analyst EGRAG CRYPTO revealed the results of a poll created on 13 December. In the poll, he asked his followers if they identify XRP’s current price levels as a blessing or if they are frustrated with the cryptocurrency’s price performance. In today’s post, he shared that 56.3% of the 3,000 voters are frustrated with XRP’s latest price movements.
Meanwhile, 43.7% of the voters either feel “discontent with their current holdings” or are confident in their investment decisions, added the analyst. According to EGRAG CRYPTO, 70% of the voters are preparing to sell their holdings as the coin nears an historical peak, while only 5% are considering holding XRP beyond the $10 mark.
XRP investors seemed to have offloaded some of their holdings over the past 24 hours. Data from the cryptocurrency market tracking website CoinMarketCap indicated that the remittance token was down 1.72%. As a result, the altcoin was changing hands at $0.6196 at press time.
Looking at the longer-term timeframes, XRP’s latest drop in price was a continuation of its negative weekly trend. CoinMarketCap shows that the cryptocurrency was down 9.91% over the past seven days.
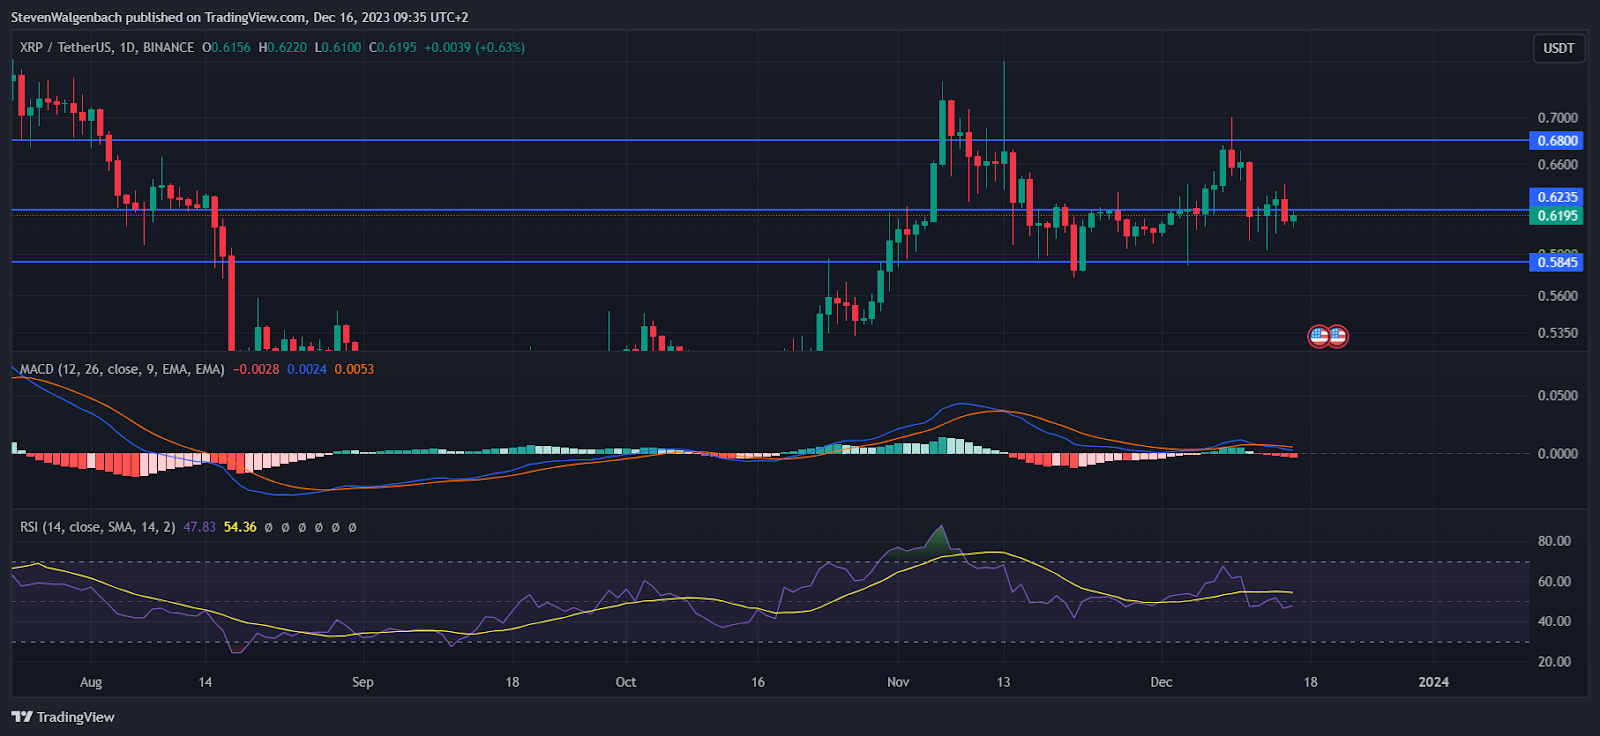
XRP may be at risk of dropping down to $0.5845 in the next few days, as it lost the support of the $0.6235 mark over the past 48 hours. This bearish thesis may be invalidated if XRP closes a daily candle above $0.6235 in the next 48 hours. In this more bullish scenario, the altcoin could climb to $0.68.
Technical indicators for XRP suggest that bears currently have the upper hand against bulls. Both the Moving Average Convergence Divergence (MACD) and the Relative Strength Index (RSI) indicators signaled that sellers have the upper hand.
The MACD line was positioned below the MACD Signal line, while the RSI line was positioned below the RSI Simple Moving Average (SMA) line. These technical flags both hint at diminishing buyer strength and could signal that XRP’s negative trend will continue in the next 24-48 hours.
Disclaimer: The information presented in this article is for informational and educational purposes only. The article does not constitute financial advice or advice of any kind. Coin Edition is not responsible for any losses incurred as a result of the utilization of content, products, or services mentioned. Readers are advised to exercise caution before taking any action related to the company.
 Price Prediction 2026, 2027, 2028, 2029, 2030-2050")


