


- XRP market faces selling pressure and potential short-term rebound.
- Low trading volumes and negative momentum raise caution for traders.
- Keltner Channel bands suggest XRP may test lower support levels.
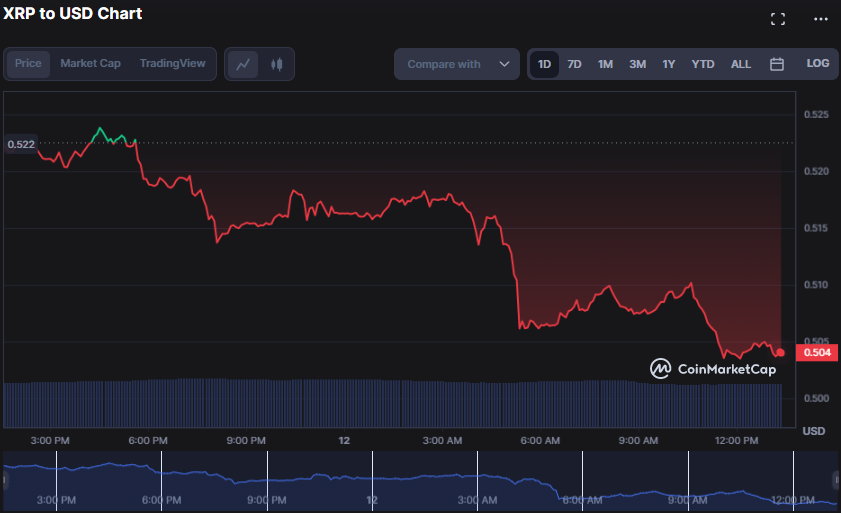
The XRP (XRP) market has fallen precipitously over the last 24 hours, with optimistic efforts to rebound thwarted after the $0.5238 intra-day high proven to be a solid resistance level. During the decline, the bears effectively dropped the XRP price from its peak to an intraday low of $0.5034, where it found some support.
As of press time, the bears were still in control of the XRP market, causing the price to fall to $0.5043, a 3.39% drop from the previous day’s close.
Due to the risk of future price falls, traders were cautious and unwilling to purchase XRP, resulting in low trading volumes in the market. Consequently, market capitalization and 24-hour trading volume declined by 3.39% and 1.98%, respectively, to $26,063,967,706 and $1,155,920,019.
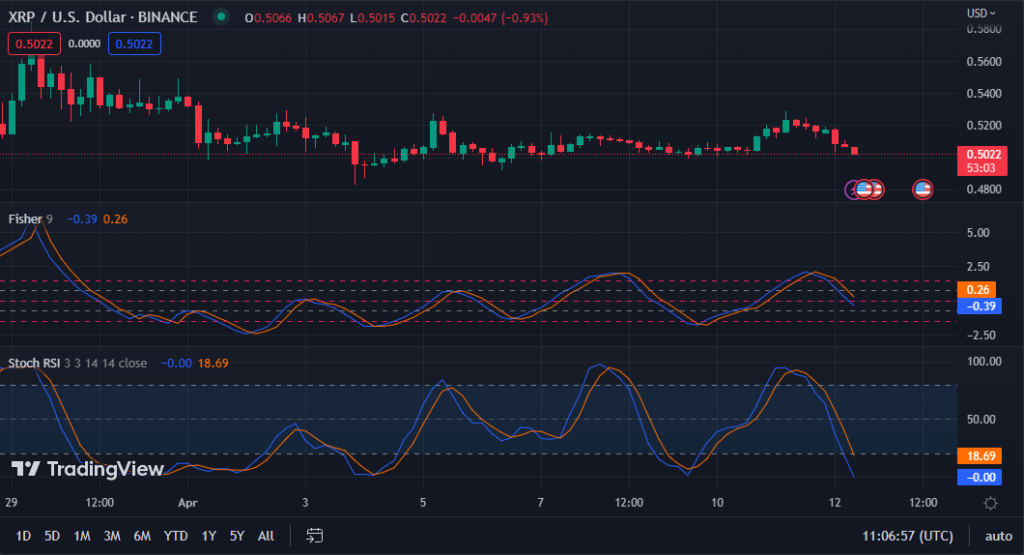
With a Fisher Transform rating of -0.39, the bear’s hand in the XRP market may acquire momentum and drive the price further down.
This movement indicates that selling pressure is building, and traders may want to consider taking short positions or waiting for a possible trend reversal before establishing long positions.
The stochastic RSI value of -0.00 and movement below the signal line suggest that XRP is oversold and may undergo a short-term rebound. However, traders should be cautious since this might be a relief rally rather than a long-term trend reversal.
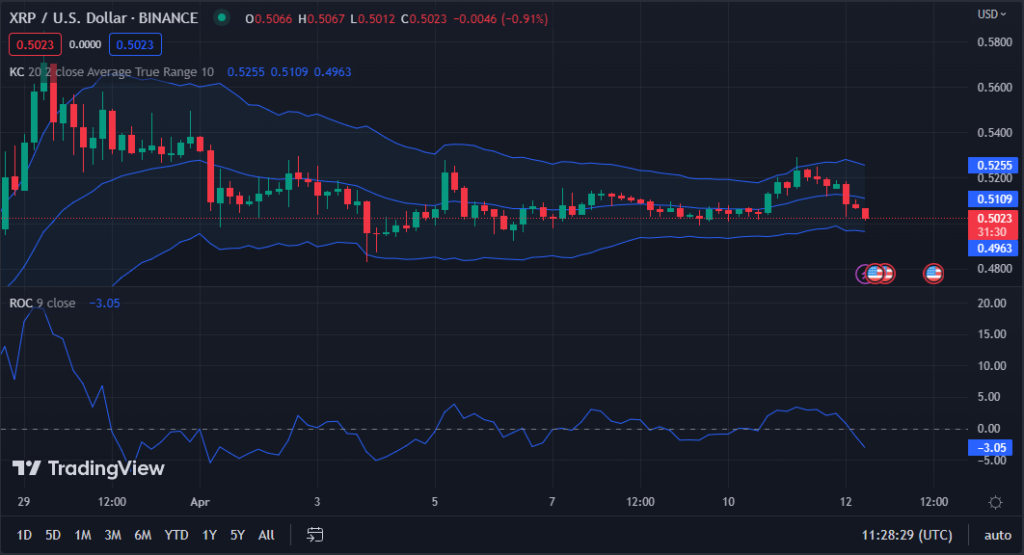
On the XRP 4-hour price chart, the Keltner Channel bands are moving south, with the top bar at 0.5255 and the bottom bar at 0.4962. This action suggests that the price of XRP may continue to fall and test the lower support level in the immediate term. The price action motion, building red candlesticks toward the bottom band, supports this view.
If the price movement continues in this manner and breaks below the lower band, this is a sign that the market is oversold, and a reversal or rebound could follow.
With a Rate of Change of -3.01, the market exhibits significant negative momentum, which might lead to more downward movement if price action breaches critical support levels. If, on the other hand, the ROC rating improves and goes into positive territory, it might suggest a change in momentum and possible buying opportunities for traders.
In conclusion, the XRP market faces bearish pressure, and traders should exercise caution when considering long positions. Oversold conditions may lead to short-term rebounds, but the overall trend remains uncertain.
Disclaimer: The views, opinions, and information shared in this price prediction are published in good faith. Readers must do their research and due diligence. Any action taken by the reader is strictly at their own risk. Coin Edition and its affiliates will not be liable for direct or indirect damage or loss.
Disclaimer: The information presented in this article is for informational and educational purposes only. The article does not constitute financial advice or advice of any kind. Coin Edition is not responsible for any losses incurred as a result of the utilization of content, products, or services mentioned. Readers are advised to exercise caution before taking any action related to the company.
 Price Prediction 2026, 2027, 2028, 2029, 2030-2050")
 Price Prediction 2026, 2027, 2028, 2029, 2030-2050")


