


- XRP remains in a strong downtrend as price stays below all major moving averages.
- Open interest has dropped sharply, signaling reduced speculative leverage in XRP.
- Persistent net outflows and weak inflows keep pressure on XRP near key support zone
XRP remains under heavy pressure as technical weakness, declining speculative activity, and persistent capital outflows continue to weigh on market sentiment. The cryptocurrency has lost several important support levels in recent weeks, leaving traders focused on whether buyers can defend the area near $1.10. While oversold conditions suggest selling momentum may be slowing, broader market indicators still point to a challenging environment for the token.
Technical Structure Remains Firmly Bearish
The daily chart shows XRP trading near $1.13 after a sharp decline from previous highs. Significantly, the asset now sits below its 20-day, 50-day, 100-day, and 200-day exponential moving averages. This alignment reflects a strong downtrend and highlights continued seller control.
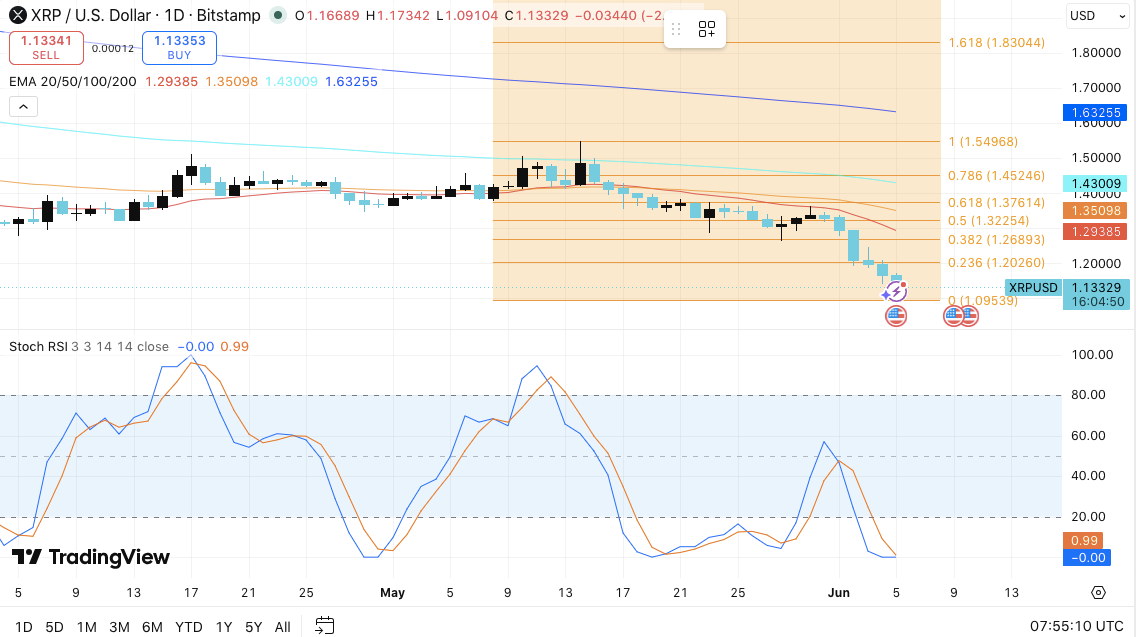
Moreover, XRP recently slipped beneath the $1.27 Fibonacci support level. That breakdown exposed the crucial $1.09-$1.10 region, which now serves as the market’s most important support zone. If buyers fail to protect this area, the next downside targets emerge near the psychological $1.00 level. A deeper breakdown could open the door toward the $0.95-$0.90 range.
Related: Siren (SIREN) Price Prediction 2026-2050: Will SIREN Hit $1.5 Soon?
On the upside, XRP must first recover the $1.20-$1.22 zone before bulls can regain momentum. Beyond that level, resistance strengthens around $1.27. Additionally, the $1.32-$1.38 area represents a major hurdle because it combines key Fibonacci retracement levels with several moving averages.
Open Interest Decline Signals Reduced Speculation
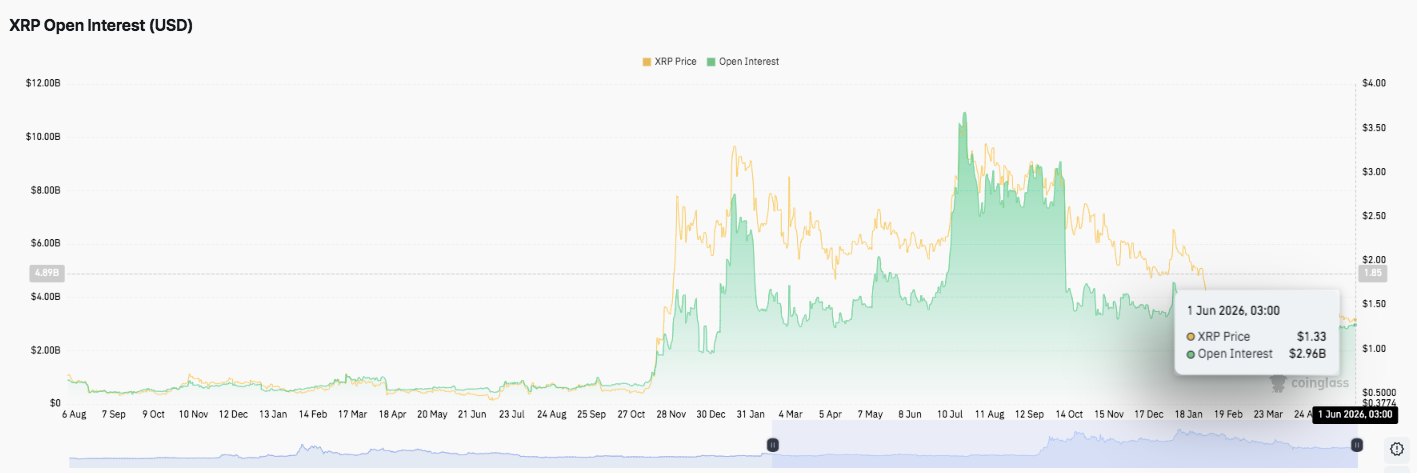
Derivatives data paints a similar picture. Open interest expanded aggressively during XRP’s rally toward the $3.50-$3.70 region. At its peak, leveraged positions pushed total open interest above $10 billion.
However, market conditions changed as prices entered a prolonged correction. Consequently, traders steadily reduced exposure, causing open interest to fall sharply. Recent figures show stabilization near the $2.8-$3.0 billion range.
This development may carry mixed implications. On one hand, lower leverage reflects weaker speculative demand. On the other hand, the removal of excessive leverage could create a healthier market structure for future price recovery.
Persistent Outflows Continue to Weigh on Sentiment
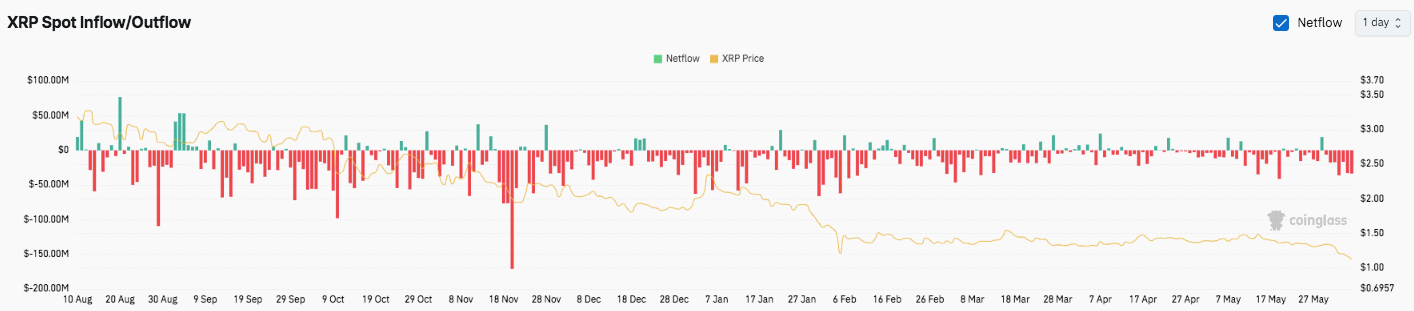
Spot market activity also highlights ongoing challenges. Throughout the observed period, outflows consistently exceeded inflows, signaling that investors continued moving capital away from XRP.
Related: Dogecoin Price Prediction: DOGE Breaks Four-Month Channel and the Only Level Left Is $0.067
Although occasional inflow spikes appeared, they failed to alter the broader trend. Moreover, larger net outflow events frequently emerged during key periods of price weakness, reinforcing bearish sentiment.
Technical Outlook for XRP Price
Key levels remain clearly defined as XRP continues to trade under pressure heading into the current cycle.
Upside levels: $1.20, $1.22, and $1.27 act as immediate recovery hurdles. A breakout above this cluster could extend gains toward $1.32 and $1.38, where multiple moving averages converge.
Downside levels: The $1.09–$1.10 zone remains the critical trend support. Below that, downside exposure opens toward $1.00, followed by $0.95 and $0.90 as deeper retracement targets.
Resistance ceiling: The $1.27 level, aligning with key Fibonacci resistance, is the primary barrier XRP must reclaim to shift short-term momentum. Broader resistance strengthens around $1.32–$1.38, where multiple technical indicators cluster.
The technical structure suggests XRP is consolidating within a bearish-to-neutral compression phase after an extended decline. Price action continues to trade below major moving averages, indicating that sellers still dominate the broader trend. However, oversold conditions are beginning to emerge, hinting at potential volatility expansion ahead.
Will XRP Go Up?
The near-term direction of XRP hinges on whether buyers can defend the $1.09–$1.10 support zone long enough to build momentum toward $1.22–$1.27. A sustained move above this resistance cluster could trigger a relief rally toward $1.32–$1.38.
Related: Bitway Price Prediction: BTW Surges Over 220% as Bulls Target $0.05
However, failure to hold current support risks accelerating downside pressure toward $1.00 and possibly deeper levels near $0.95. For now, XRP remains at a decisive technical juncture, with market sentiment and liquidity flows likely to determine the next major move.
Disclaimer: The information presented in this article is for informational and educational purposes only. The article does not constitute financial advice or advice of any kind. Coin Edition is not responsible for any losses incurred as a result of the utilization of content, products, or services mentioned. Readers are advised to exercise caution before taking any action related to the company.


