 Price Prediction for July 17")
XRP price extended its bullish streak to a local high of $3.03 before facing intraday resistance, following the SEC’s approval of the ProShares Ultra XRP ETF. While the futures-based product does not directly hold XRP, the approval has injected renewed optimism across the market. At the time of writing, XRP price today trades near $2.91 after a minor intraday pullback.
XRP Price Forecast Table: July 17, 2025
| Indicator/Zone | Level / Signal |
| XRP price today | $2.91 |
| Resistance 1 | $3.00–$3.03 (psychological + fib) |
| Resistance 2 | $3.20–$3.40 (March high) |
| Support 1 | $2.84–$2.86 (EMA20 + Bollinger mid) |
| Support 2 | $2.70 (Fib 0.236) |
| RSI (30-min) | 53.81 (neutral, cooling) |
| MACD (30-min) | Flattening, early divergence |
| Bollinger Bands (4H) | Upper band resistance near $3.00 |
| EMA Cluster (4H) | 20 EMA support at $2.86 |
| ChandeMO (Daily) | 87.94 (strong bullish momentum) |
| Parabolic SAR (Daily) | Below price (bullish structure) |
| Derivatives Open Interest | $8.0B (+2.47%), long-biased |
| Options Open Interest | +33.24%, rising speculation |
| ETF Catalyst | ProShares Ultra XRP ETF approved |
What’s Happening With XRP’s Price?
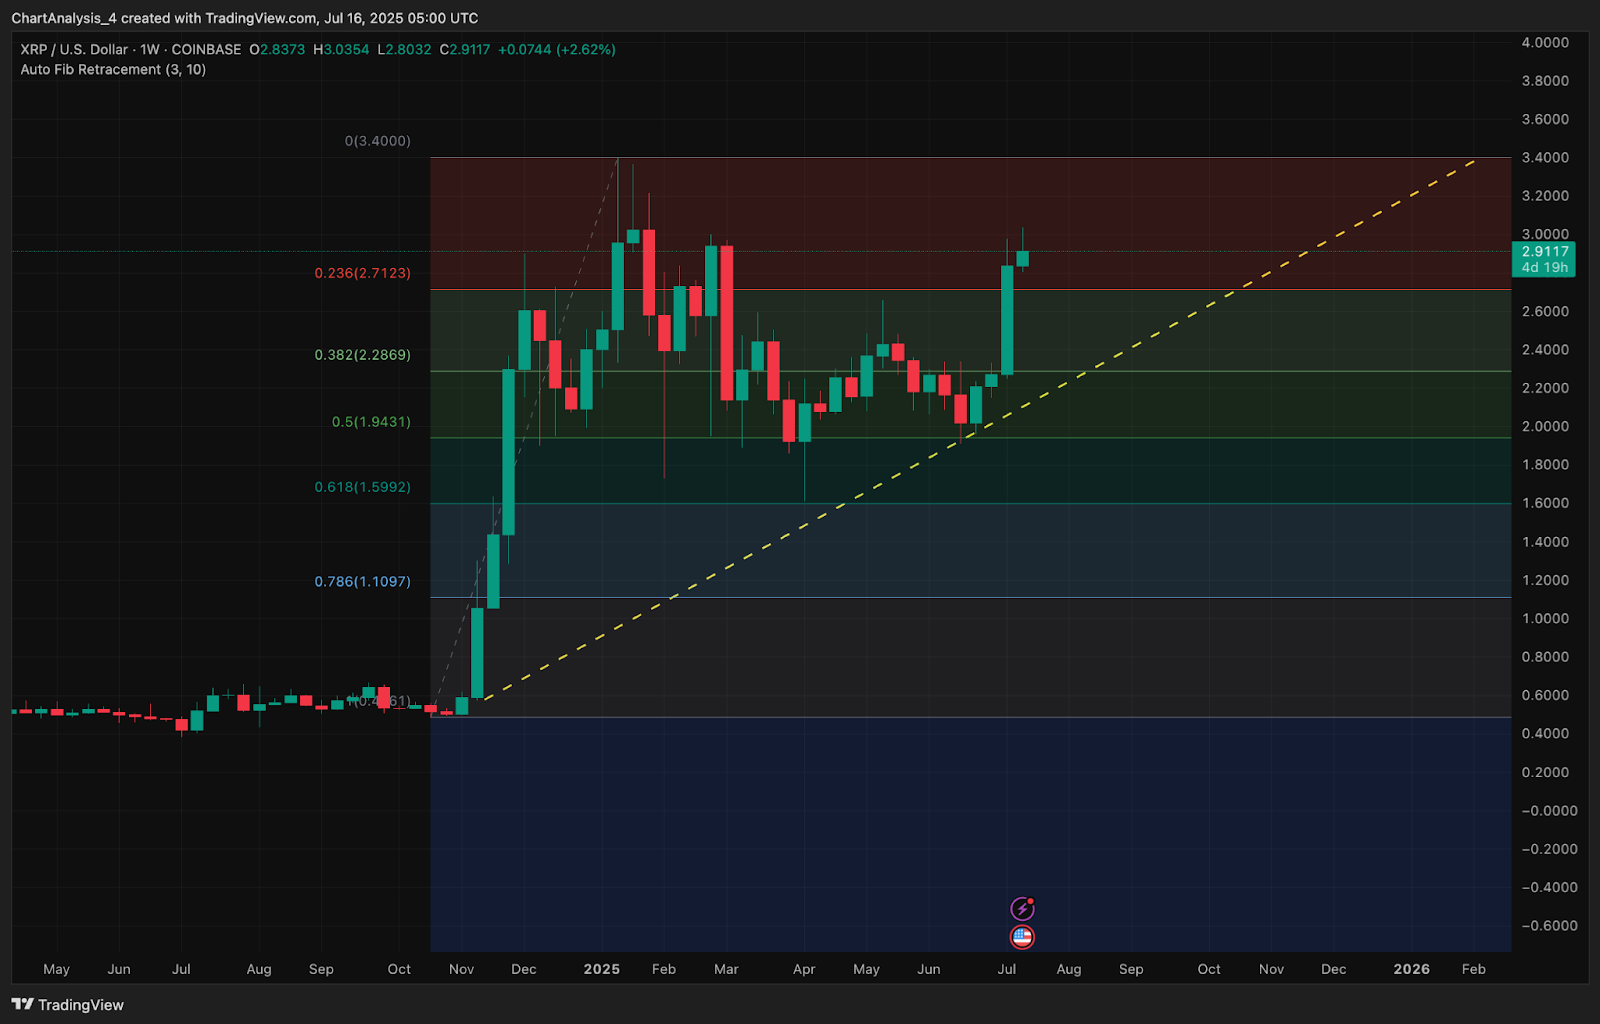
On the weekly chart, XRP price action shows a breakout from consolidation after multiple rejections below the 0.236 Fibonacci retracement at $2.71. The bullish engulfing candle has taken price toward the upper bound of the long-term channel near $3.00 which is a critical psychological and technical level that capped price action in April.
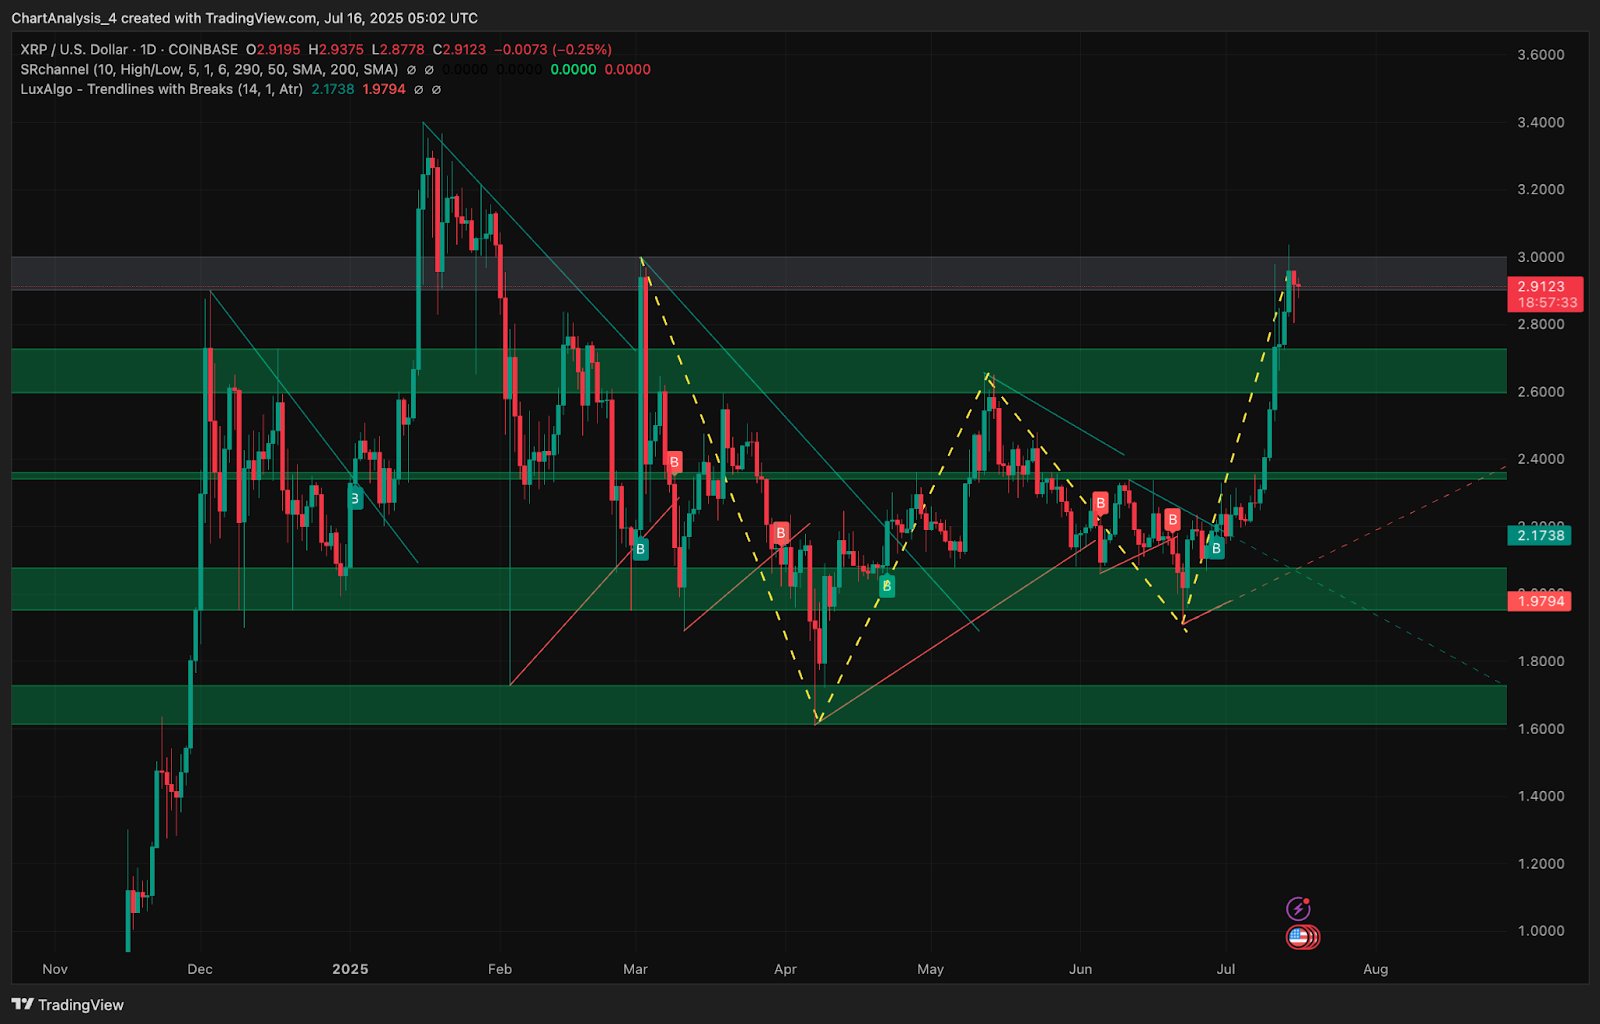
On the daily timeframe, XRP has broken out of a W pattern, with the neckline around $2.60 now flipped into support. This structure began forming in April and completed in early July, making the recent surge toward $3.00 a classic measured breakout move. The bullish impulse also reclaimed the $2.85–$2.90 liquidity zone, turning prior resistance into support. Price is now consolidating just beneath $3.00, suggesting bulls may attempt a continuation leg toward $3.20–$3.30 if momentum persists.
Why Is The XRP Price Going Up Today?
The rise in XRP price today was fueled primarily by the SEC’s July 15 approval of the ProShares Ultra XRP ETF, a leveraged futures-based product. While it does not hold XRP directly, the listing was seen as a step toward broader institutional exposure and potential spot ETF approvals.
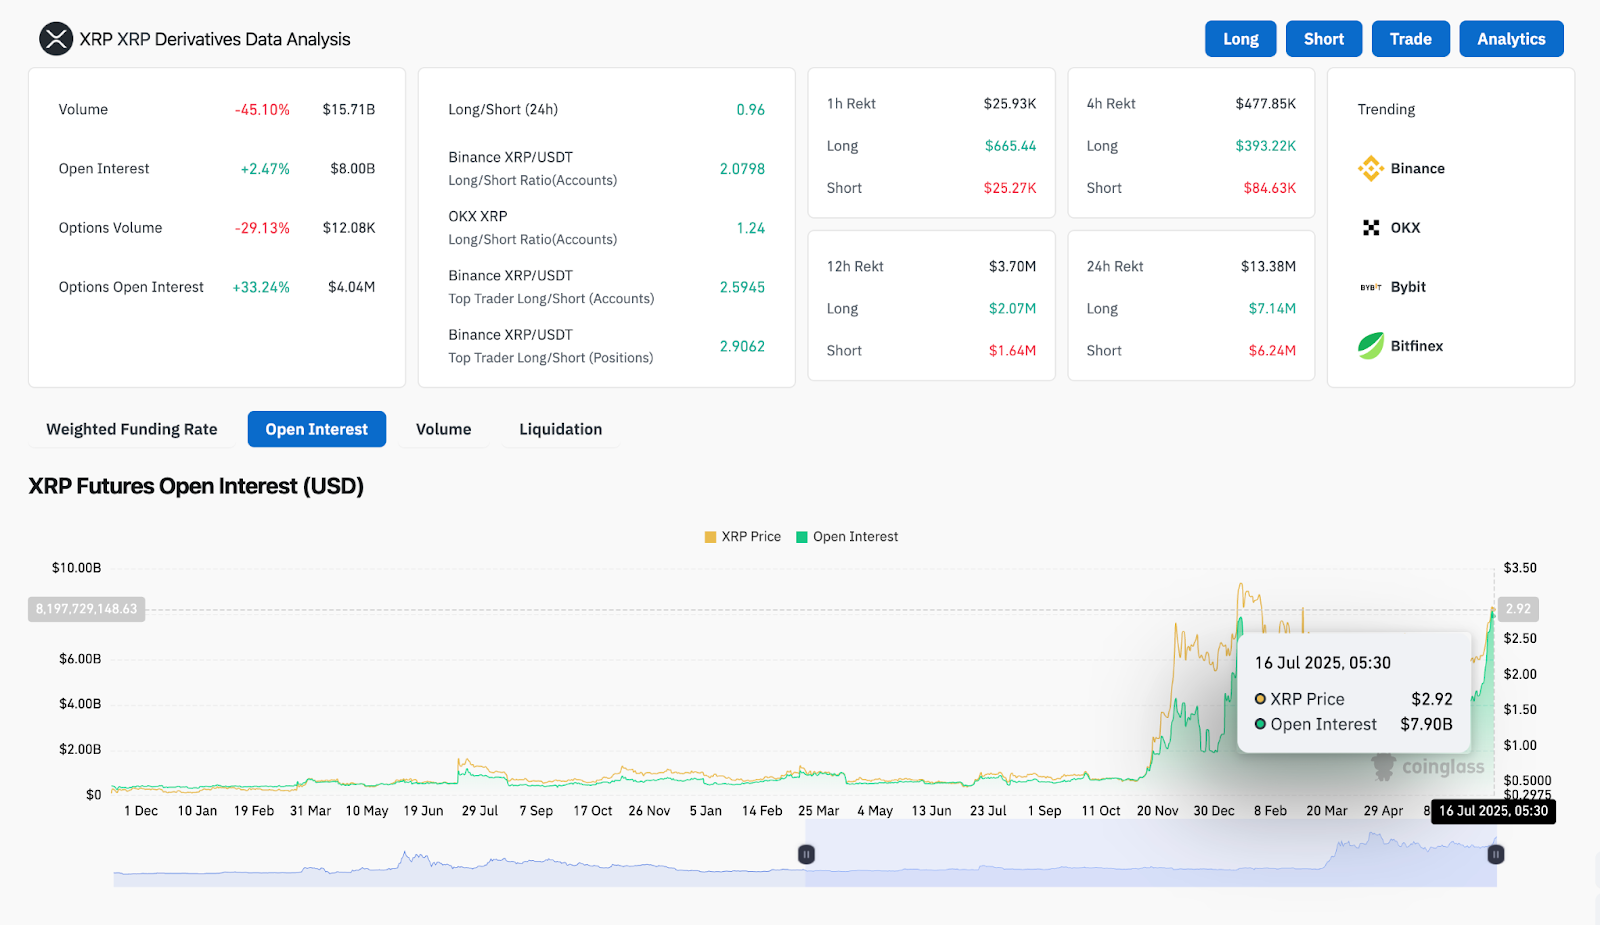
This bullish sentiment was reinforced by rising open interest. Coinglass data shows a 2.47% increase in open interest to ~$8.0B, while options open interest surged over 33%, signaling aggressive long positioning. Despite a drop in trading volume (-45.10%), the bias remains positive, with the Binance long/short ratio showing 2.59 on top traders.
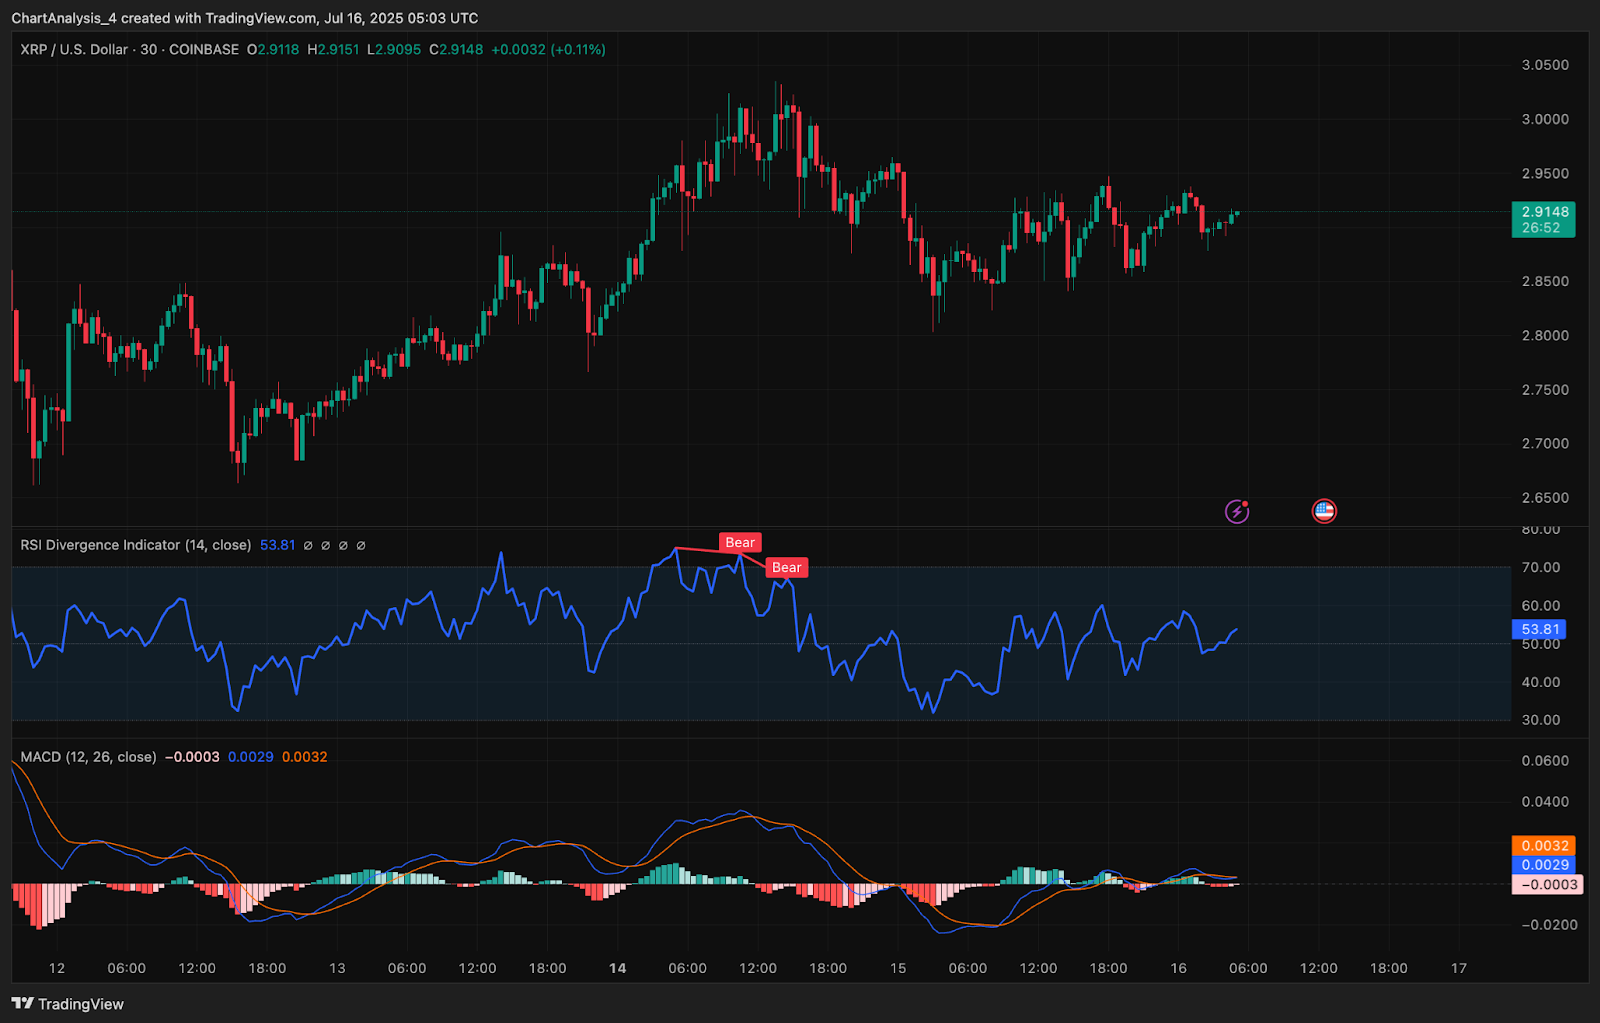
The MACD on the 30-minute chart is showing early signs of flattening momentum, while RSI at 53.81 signals ongoing consolidation. However, the daily Parabolic SAR dots remain below price, and the Chande Momentum Oscillator at 87.94 suggests strong underlying bullish pressure.
Legislative sentiment also added short-term volatility. The U.S. House’s rejection of the GENIUS Act weighed on broader crypto sentiment earlier in the week. However, the XRP-specific bullish catalyst from the ETF approval helped XRP outperform despite the setback.
Momentum Indicators and Chart Structure Remain Bullish
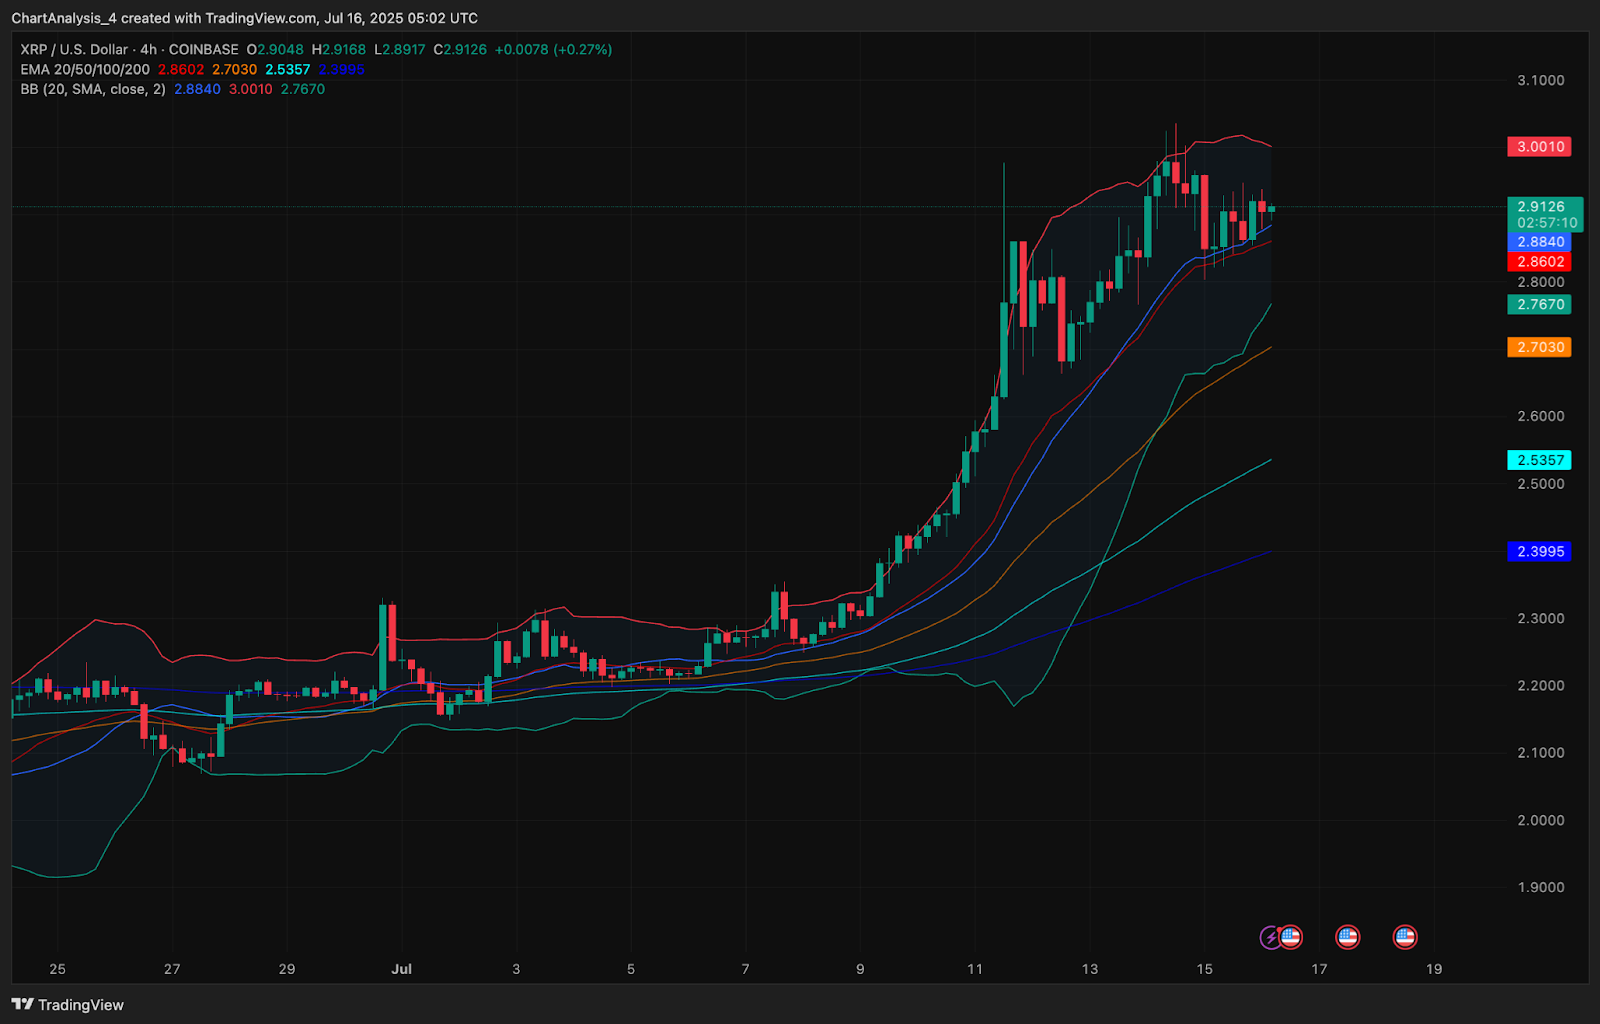
On the 4-hour chart, XRP price remains comfortably above the EMA cluster (20/50/100/200), with the 20 EMA offering near-term support at $2.86. Bollinger Bands are wide and price is riding the upper band near $3.00, indicating sustained upside momentum. A clean close above the upper Bollinger Band could trigger a volatility expansion.
On the daily chart, Parabolic SAR dots remain firmly below price, confirming that the current trend remains bullish. This reinforces that any short-term consolidation is likely a pause rather than a reversal, unless SAR flips above $2.90.
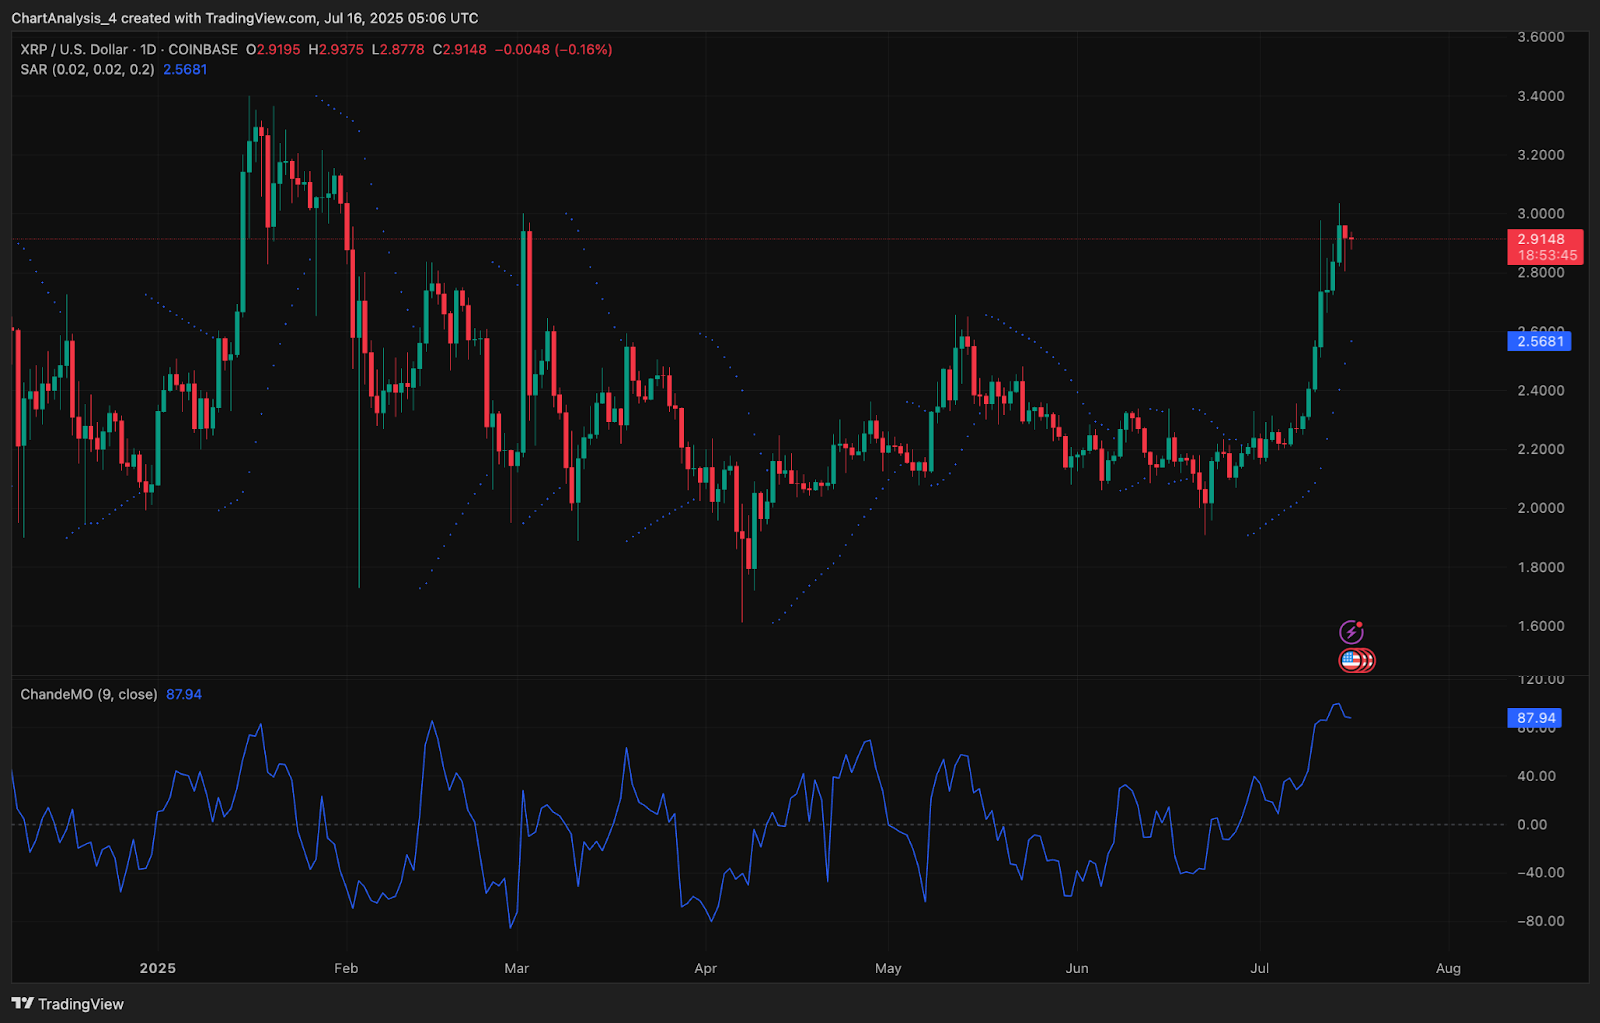
The Chande Momentum Oscillator (ChandeMO) is also printing at 87.94, one of its highest readings this year. Such elevated momentum levels typically occur only during powerful impulse waves, and they suggest that buying strength is not yet exhausted. While this could lead to temporary overbought conditions, it also supports the idea of a continuation move above $3.00 in the coming sessions.
XRP Price Prediction: Short-Term Outlook (24H)
XRP price is likely to remain volatile as it tests the $3.00–$3.03 resistance range. If bulls break above this zone with volume, the next key resistance lies at $3.20 followed by $3.40. A move beyond this level would mark a new YTD high and potentially ignite broader altcoin rotation.
On the downside, a rejection from $3.00 could trigger a short-term retest of $2.84–$2.86, which aligns with the 20 EMA and mid-Bollinger Band. Below that, stronger support lies near $2.70 (Fib 0.236), with invalidation for bulls likely below $2.60.
Traders should closely monitor volume behavior and derivatives funding rates as XRP consolidates just beneath macro resistance.
Disclaimer: The information presented in this article is for informational and educational purposes only. The article does not constitute financial advice or advice of any kind. Coin Edition is not responsible for any losses incurred as a result of the utilization of content, products, or services mentioned. Readers are advised to exercise caution before taking any action related to the company.


