
After plunging toward the $1.94 zone earlier this week, the XRP price today has rebounded to $2.18, breaking short-term downtrend lines and reclaiming key intraday levels. The rebound, fueled by a spike in momentum and support from the Supertrend indicator, puts the spotlight on whether bulls can sustain the move above $2.20 into June 26.
What’s Happening With XRP’s Price?
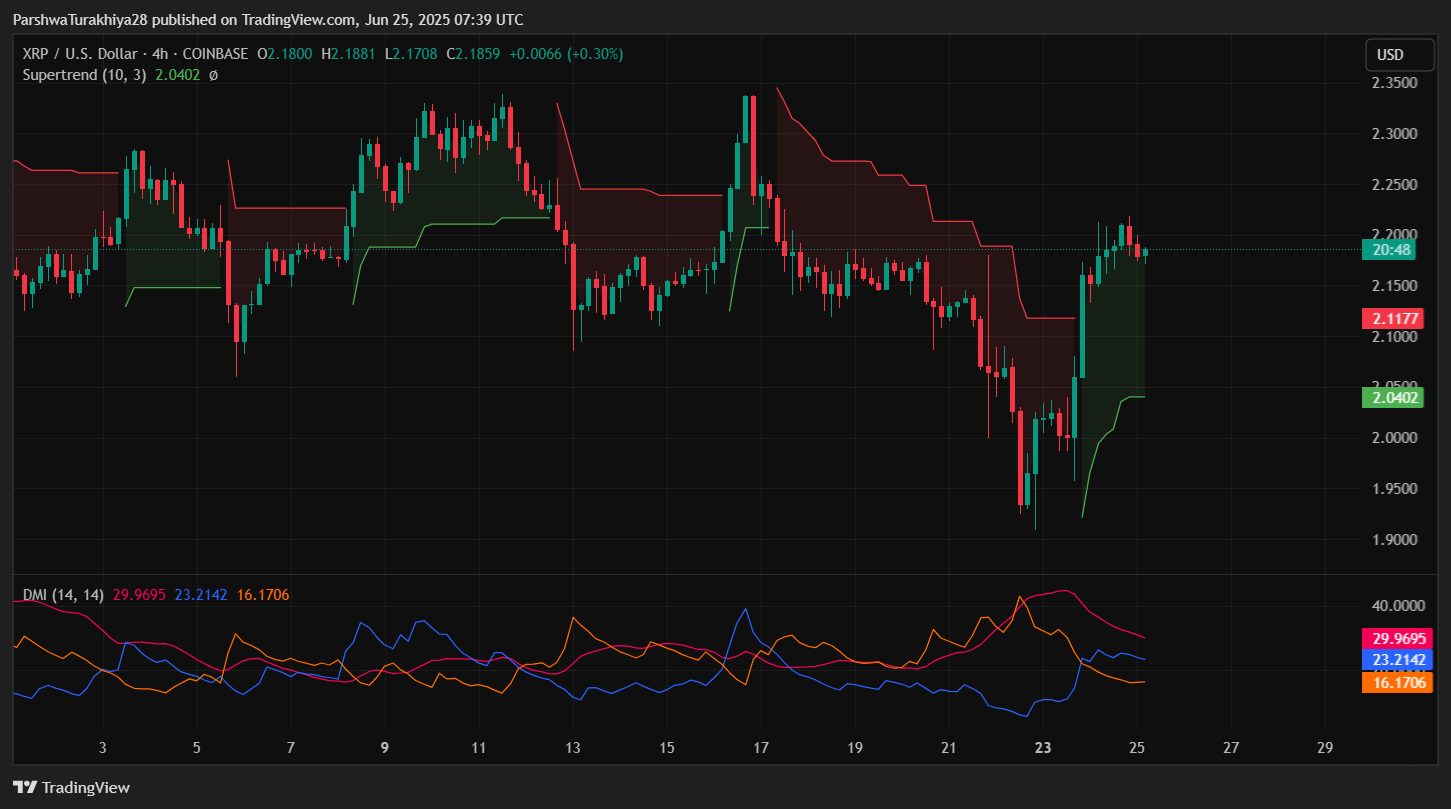
The XRP price rises sharply recently after forming a strong swing low near $1.94. The 4-hour chart shows a breakout from a descending wedge and a bullish flip on the Supertrend at $2.04. Currently, XRP is consolidating just below the $2.23 resistance line, a zone that aligns with the upper boundary of the broken trendline. Importantly, the Directional Movement Index (DMI) on the 4-hour chart shows the +DI (23.21) gaining on the -DI (29.96), and the ADX sits at 16.17, indicating a possible early trend shift but still lacking strong trend conviction.
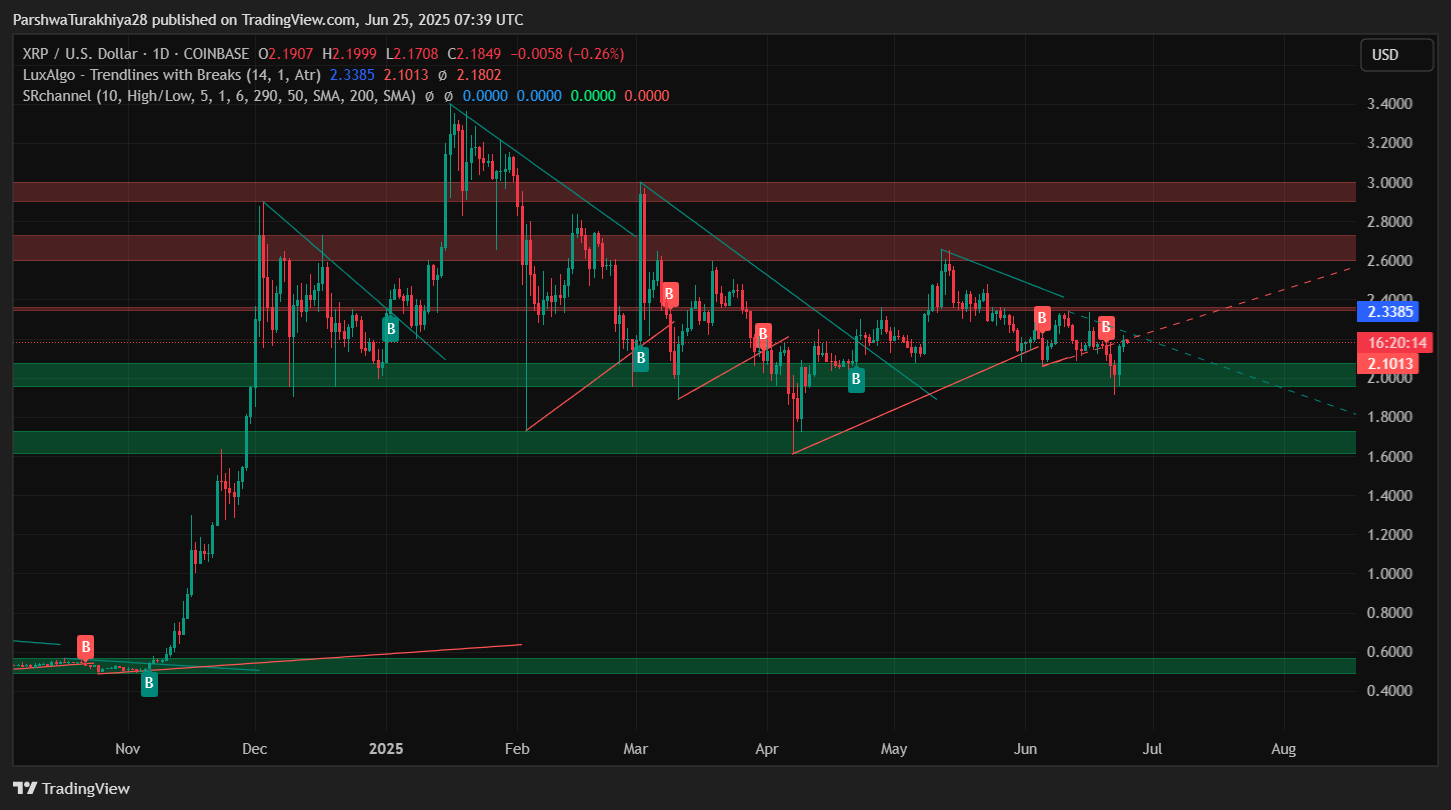
On the 1-day chart, the broader structure shows that XRP price action is still trapped within a longer-term descending wedge pattern. The upper trendline near $2.33 marks a major decision point, while the lower trendline continues to provide dynamic support closer to the $1.90 region.
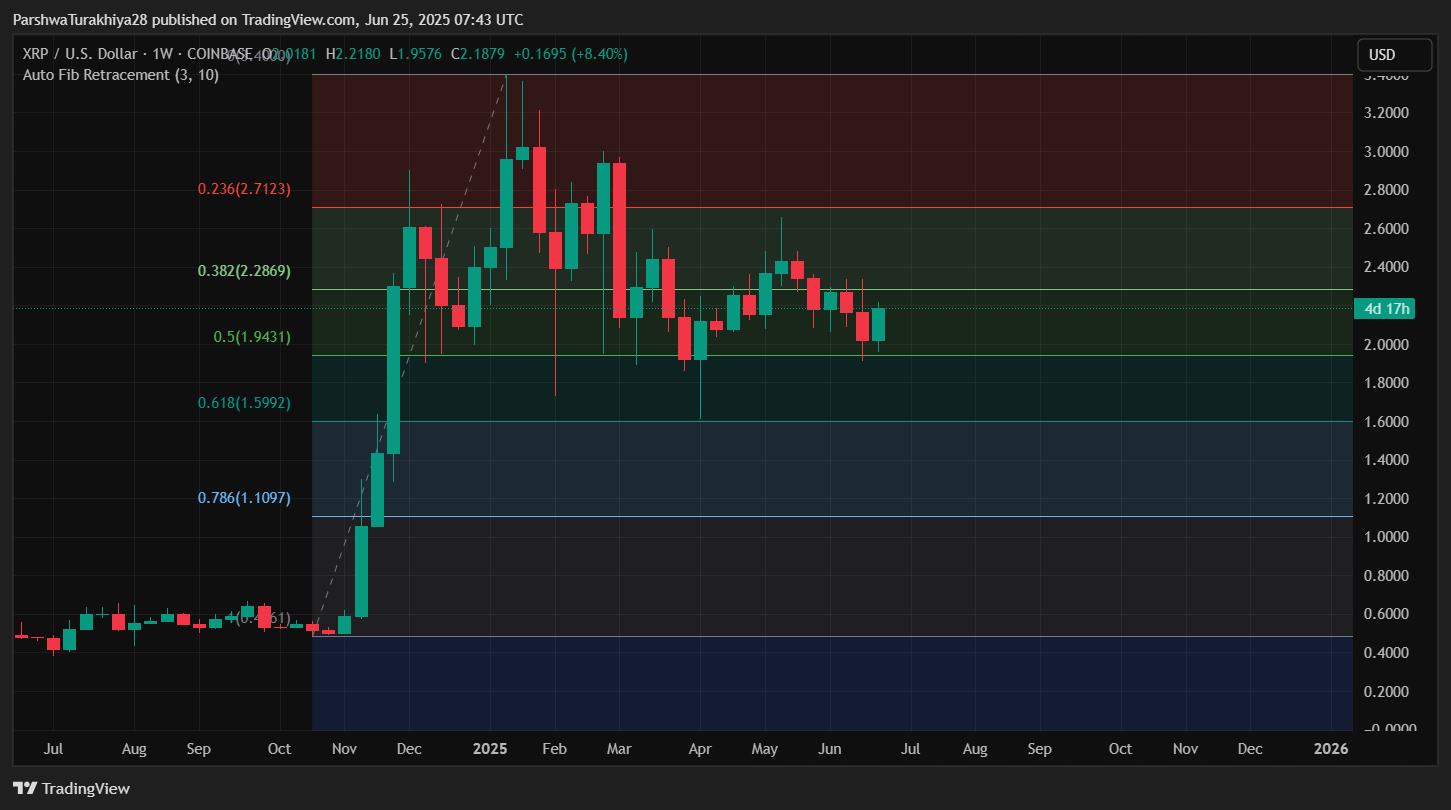
The recent XRP price spikes have pushed the asset back above the mid-level of the weekly Fibonacci range, with $1.94 (Fib 0.5) acting as the critical reversal level. A weekly close above the 0.382 Fibonacci level at $2.28 would reinforce a bullish pivot and open the door toward $2.71 (Fib 0.236) as the next upside target.
Why XRP Price Going Up Today?
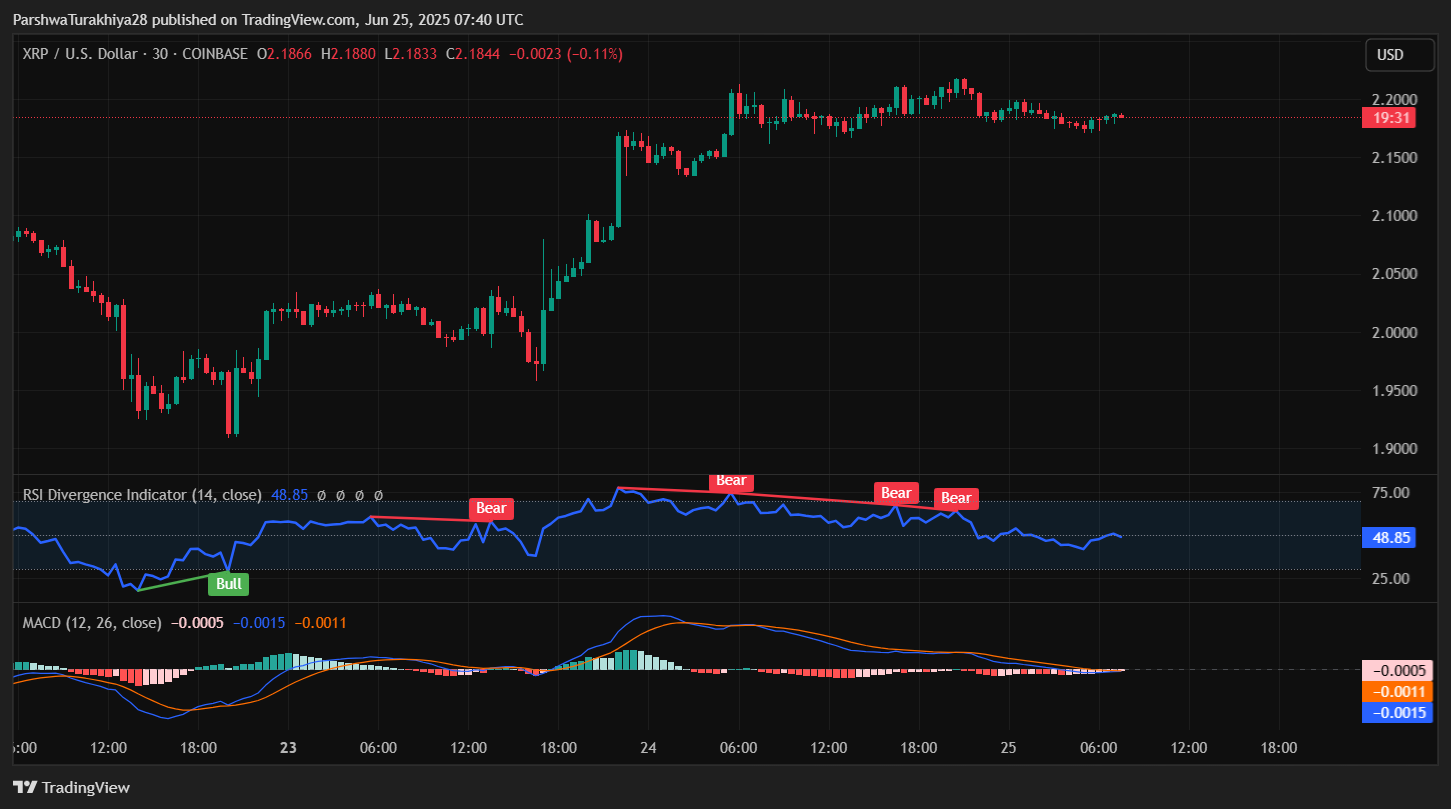
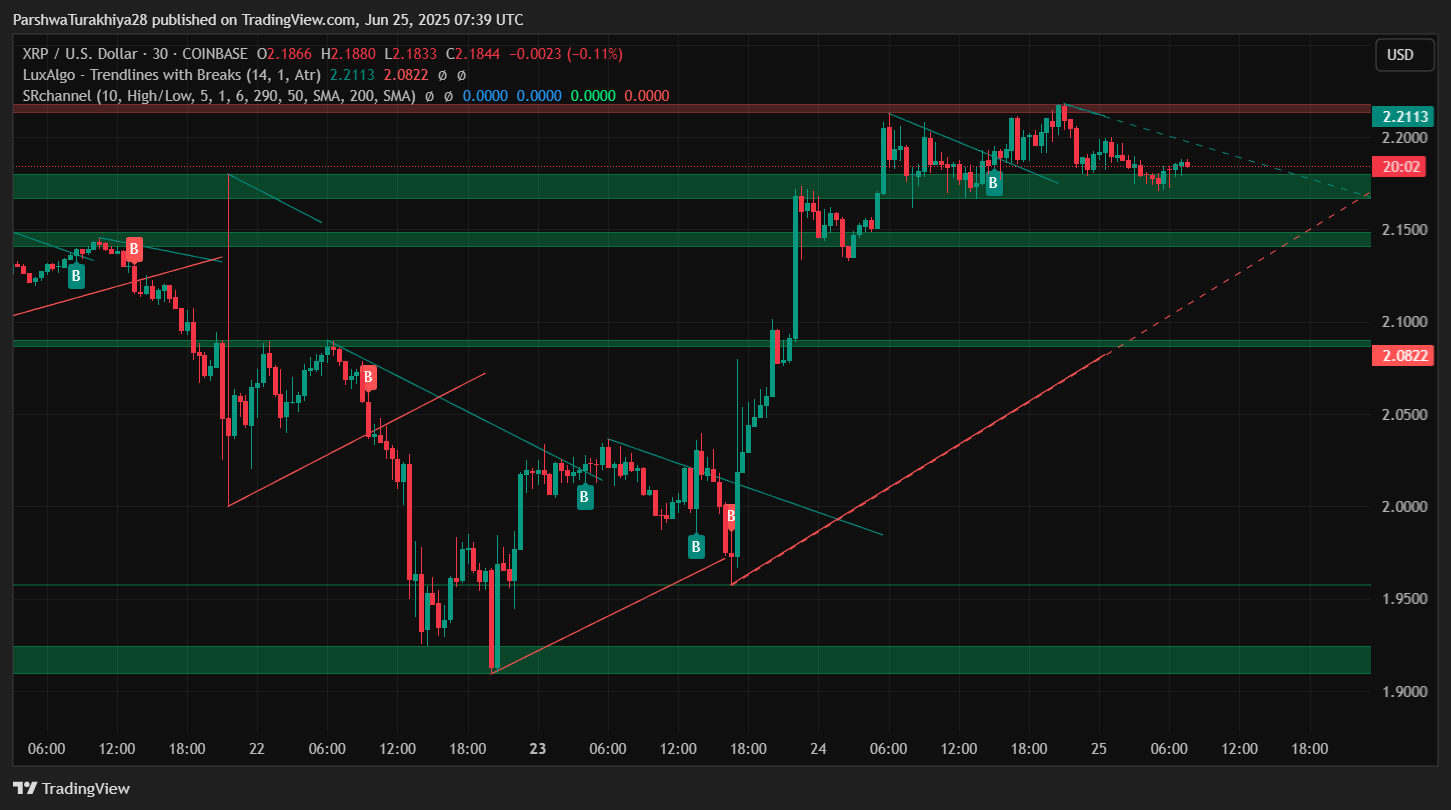
The rebound in XRP price today is largely driven by bullish technical cues and compressed volatility unwinding. On the 30-minute chart, a clean breakout from a falling wedge formation around $2.00 sparked a rally back to $2.21, with volume confirmation and supportive RSI behavior.
The 30-min RSI currently reads 48.85, following a cluster of bearish divergence signals, indicating slowing momentum. Despite this, price remains above the key trendline that supported the reversal. MACD on the same timeframe shows a flattening histogram and potential bullish crossover setup, although confirmation is still lacking.
The Parabolic SAR has flipped bullish on higher timeframes, while the Supertrend remains green above $2.04.
XRP Price Signals Tight Range Before Breakout or Rejection
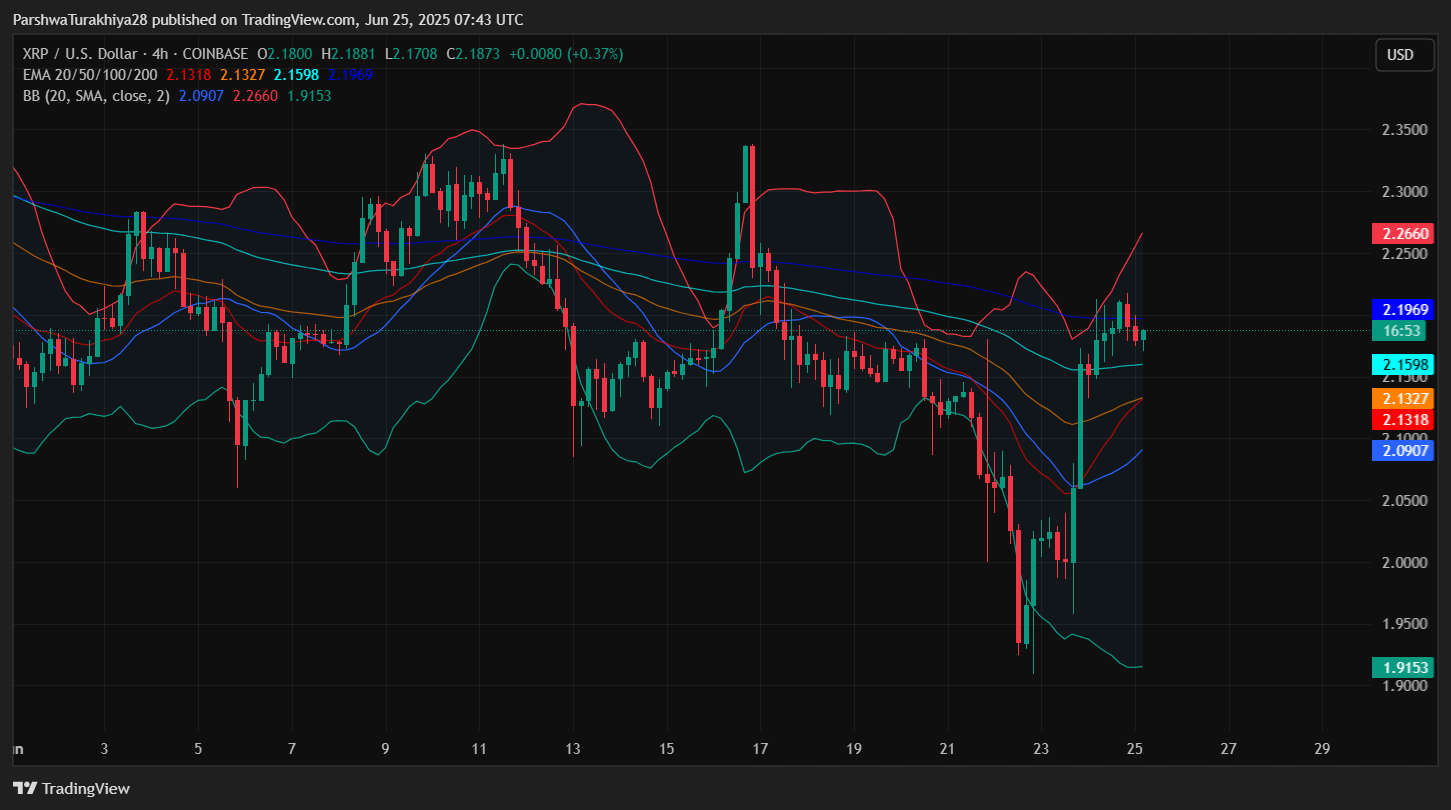
Price is now compressing just under $2.23, inside a potential flag continuation structure. Bollinger Bands on the 4-hour chart are expanding slightly, with the XRP price testing the mid-band near $2.15 and upper band at $2.26. If momentum accelerates and price reclaims the upper Bollinger Band, it would signal continuation toward $2.28–$2.33.
From a moving average perspective, XRP has reclaimed the 20 EMA ($2.13) and 50 EMA ($2.16) on the 4-hour timeframe. However, price is still struggling below the 100 EMA ($2.19) and the 200 EMA ($2.26). A cluster of resistance in this zone makes it a critical inflection point for bulls.
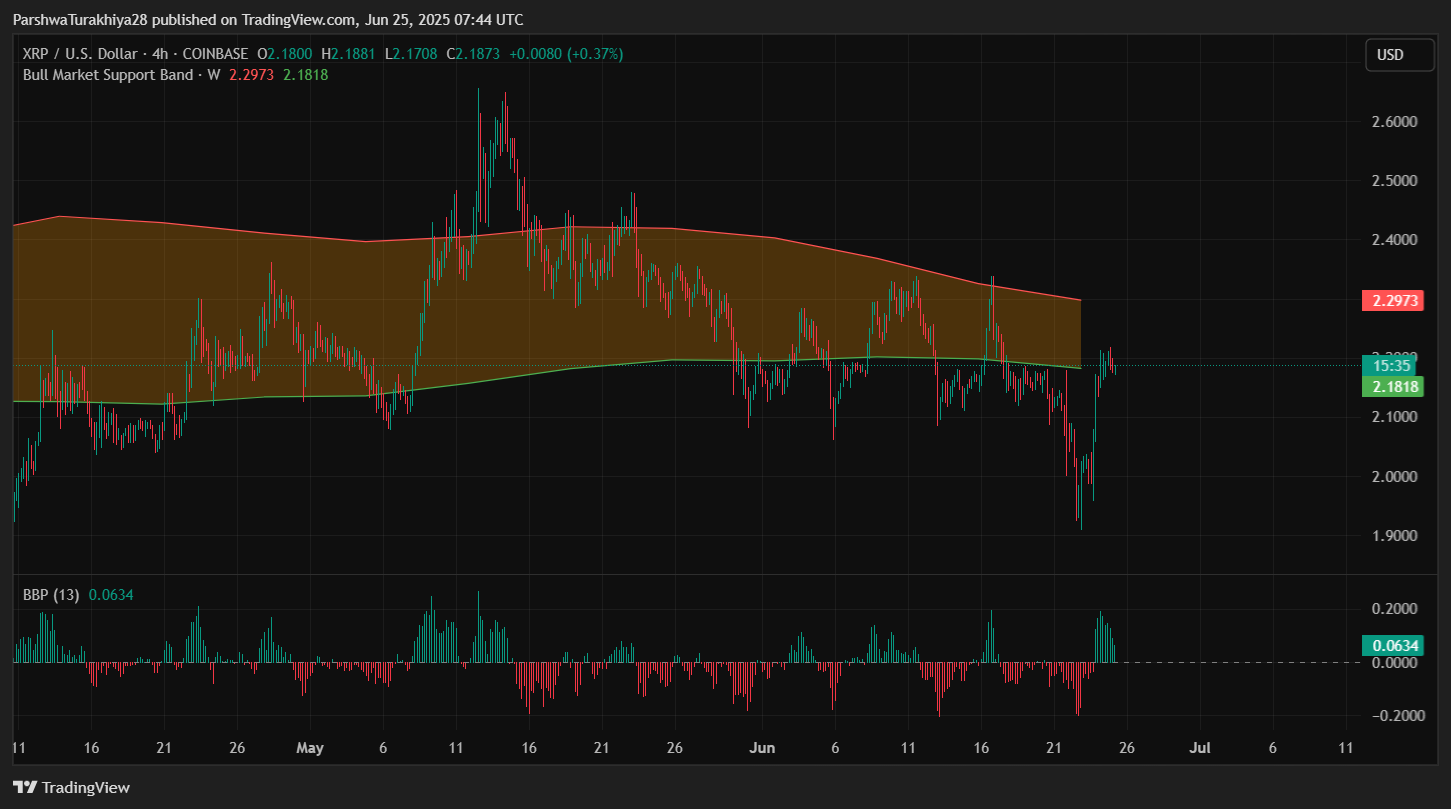
The Bull Market Support Band (4H overlay of weekly levels) shows XRP pushing into the resistance layer between $2.18 and $2.29. A breakout beyond this zone could mark a trend reversal on the medium-term chart, while rejection here would confirm bearish continuation.
XRP Price Prediction: Short-Term Outlook (24h)
Over the next 24 hours, XRP price volatility is expected to increase as the price nears the $2.23–$2.26 resistance cluster. A confirmed breakout above $2.234 would expose the $2.28–$2.33 zone, which includes the weekly 0.382 Fib level and trendline intersection.
On the downside, if XRP price today falls below $2.11 and breaks beneath $2.08, the market could quickly revisit $1.94, which now serves as a reclaimed demand zone. Volume behavior and MACD crossover confirmation will be crucial in determining the next move.
Traders should watch for a clean 30-minute or 4-hour candle close above $2.23 with rising volume for bullish confirmation. If the breakout fails, the flag structure could resolve downward toward the rising support trendline near $2.03.
XRP Price Forecast Table: June 26, 2025
| Indicator/Level | Value / Signal |
| XRP price today | $2.18 |
| Resistance 1 | $2.23 – Short-term rejection zone |
| Resistance 2 | $2.33 – Fib + trendline confluence |
| Support 1 | $2.11 – Mid-band & Supertrend |
| Support 2 | $1.94 – Weekly Fib 0.5, swing low |
| 20/50 EMA (4H) | $2.13 / $2.16 – Recently reclaimed |
| 100/200 EMA (4H) | $2.19 / $2.26 – Resistance cluster |
| Bollinger Bands (Upper/Lower) | $2.26 / $2.09 – Range limits |
| RSI (30-min) | 48.85 – Neutral with divergence flags |
| MACD (30-min) | Near zero – Waiting for crossover |
| Supertrend (4H) | Bullish above $2.04 |
| DMI (ADX / +DI / -DI) | 16.17 / 23.21 / 29.96 – Weak trend bias |
| Fibonacci Levels (Weekly) | $2.28 (0.382) / $1.94 (0.5) |
| Bull Market Band (4H) | $2.18–$2.29 – Key breakout zone |
XRP price action is currently sitting on the edge of a major decision. While bulls have regained some control, they must now reclaim the $2.23–$2.26 resistance pocket to confirm continuation. If they fail to do so, expect a retest of $2.08 and possibly $1.94. All eyes remain on momentum and volume to dictate the next breakout or breakdown.
Disclaimer: The information presented in this article is for informational and educational purposes only. The article does not constitute financial advice or advice of any kind. Coin Edition is not responsible for any losses incurred as a result of the utilization of content, products, or services mentioned. Readers are advised to exercise caution before taking any action related to the company.


