
XRP is under renewed pressure as the broader crypto market consolidates. The XRP price today is trading around $2.09, down 0.5% intraday, after facing strong rejection near the $2.20 resistance zone. Recent XRP price action reflects a bearish bias, especially as momentum indicators continue to point toward weakening bullish strength.
What’s Happening With XRP’s Price?
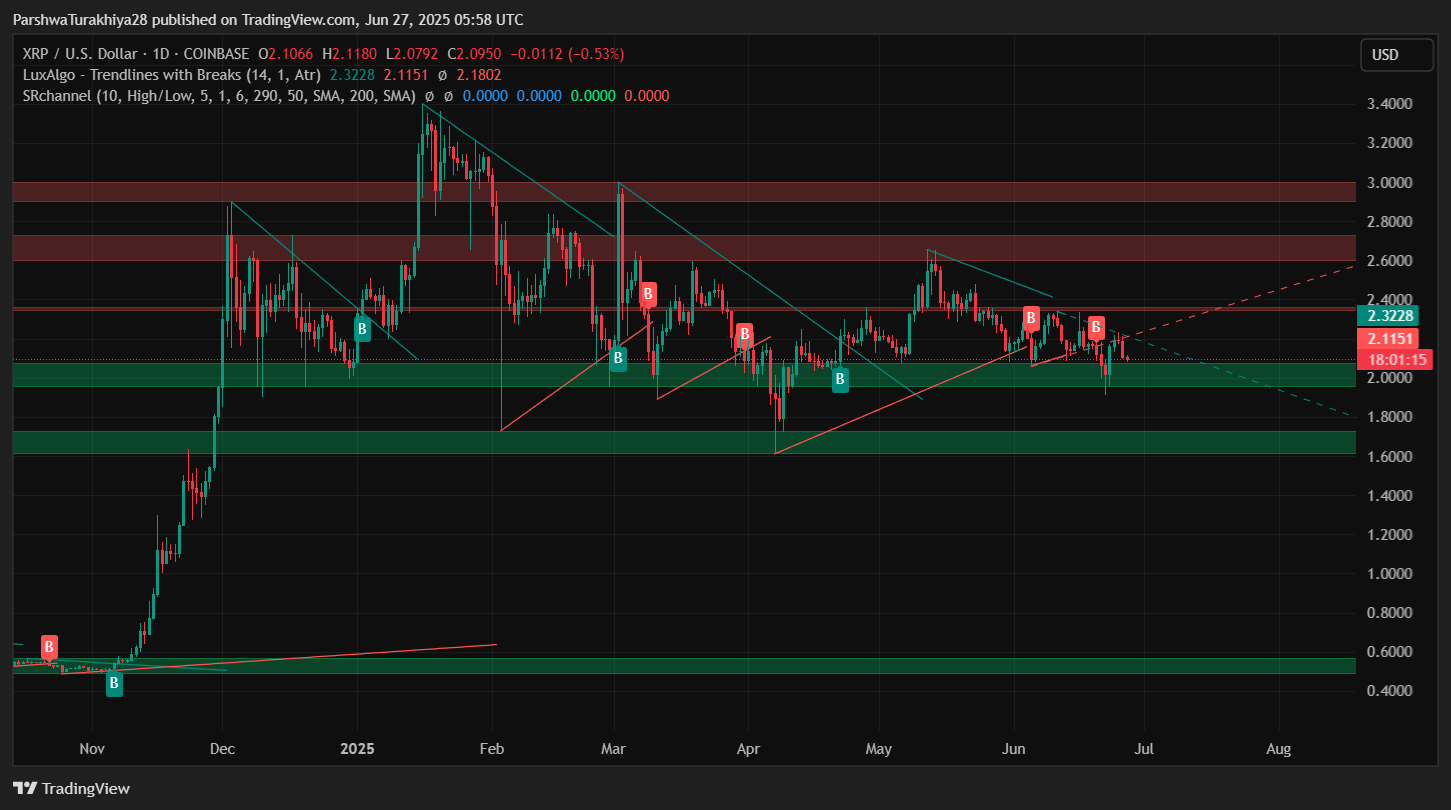
On the daily chart, XRP price remains compressed within a large symmetrical triangle pattern, with lower highs indicating persistent supply near $2.32. The recent candle structure shows repeated rejections near the descending trendline resistance, while the $2.00–$2.08 zone remains key demand.
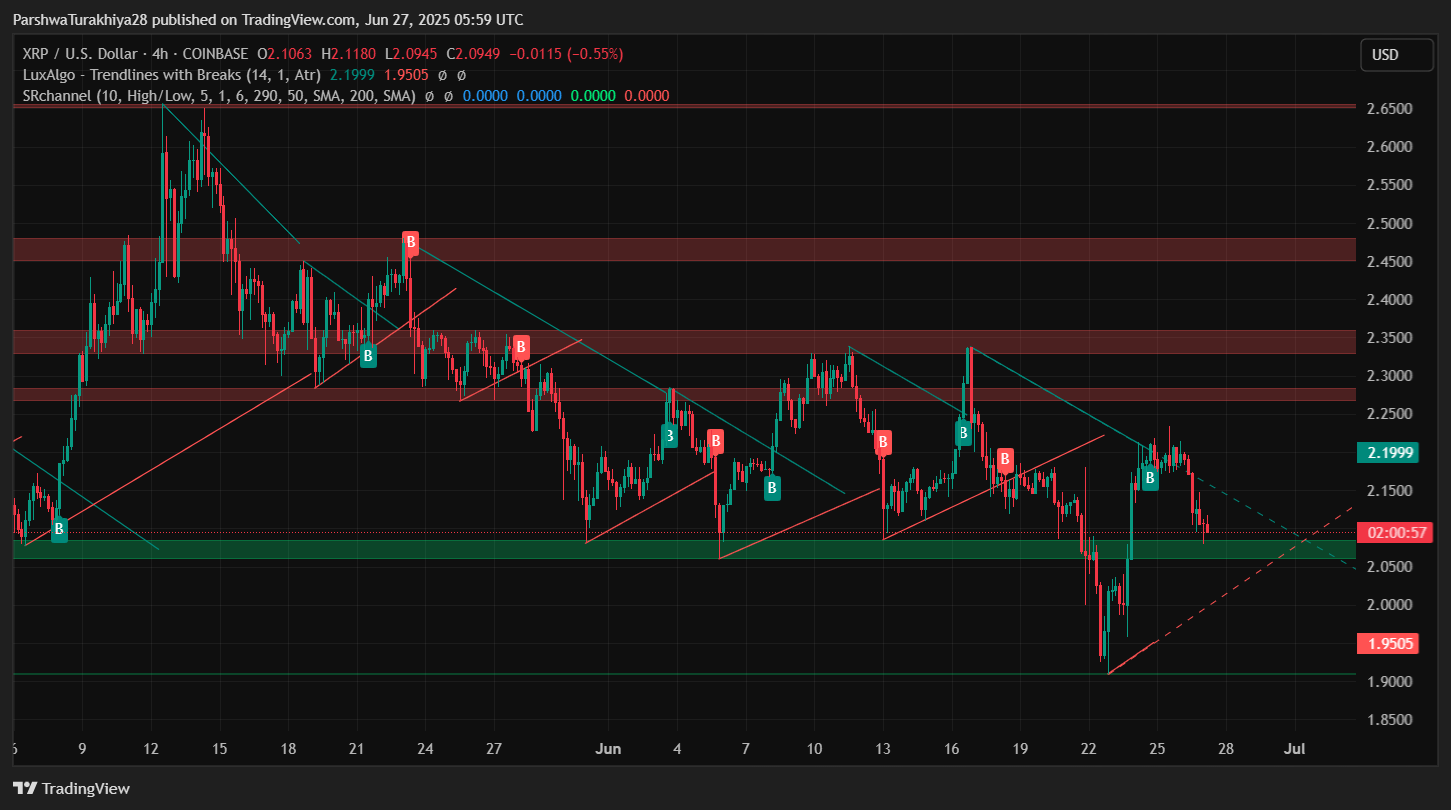
The 4-hour chart reveals a clear descending wedge formation that broke to the upside on June 25, pushing XRP price spikes briefly toward $2.20. However, price failed to hold gains and slid back below the wedge support, suggesting a potential fakeout or bull trap. This puts the focus back on the critical $2.05–$2.08 zone, which aligns with previous bounce levels.
A deeper support zone sits near $1.95, as seen from earlier demand reactions. If that level fails, XRP could revisit the broader liquidity pocket around $1.80.
Why XRP Price Going Down Today?
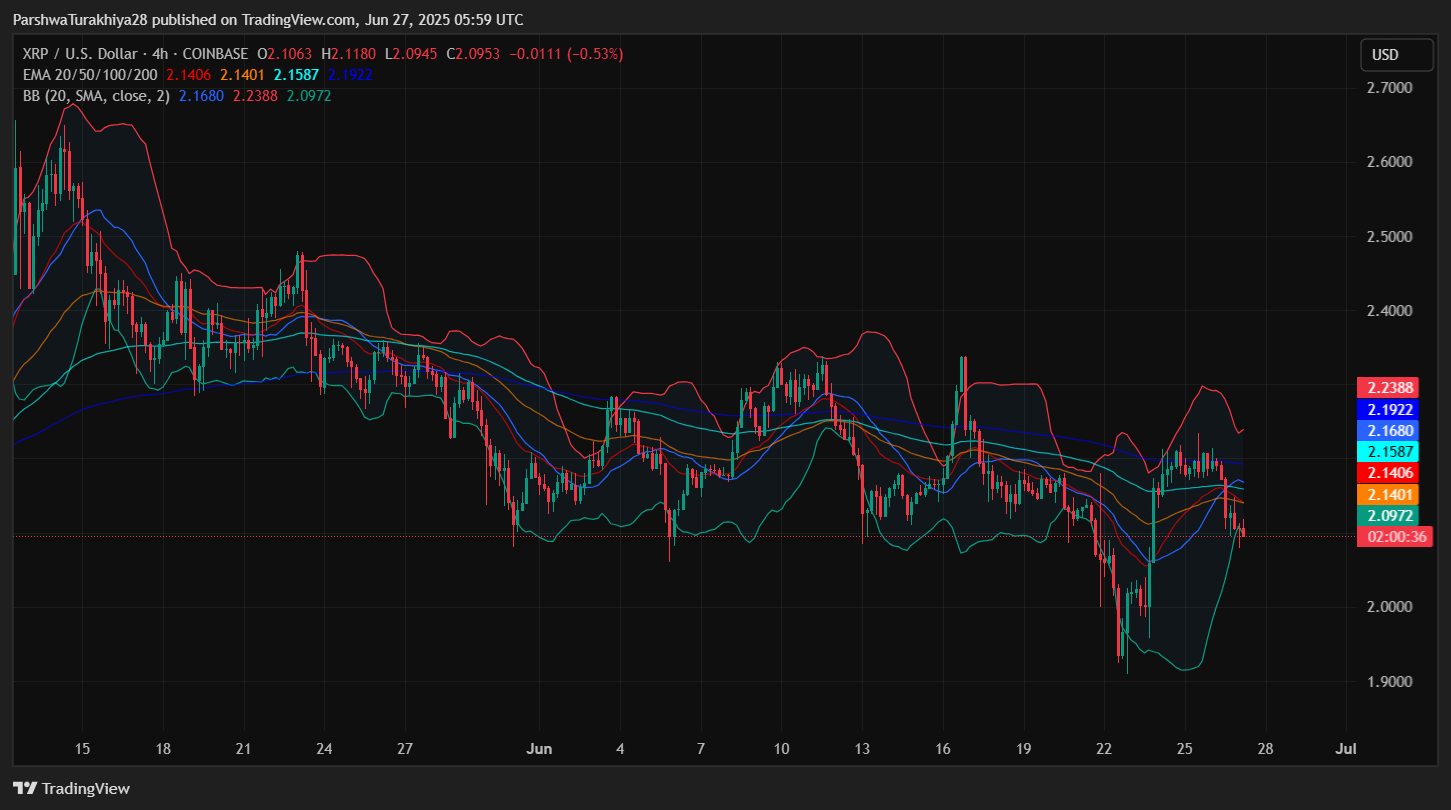
The main driver behind why XRP price going down today is a confluence of bearish signals across the 4-hour and 30-minute charts. Most notably, XRP price is trading below all major exponential moving averages. The 20/50/100/200 EMAs are stacked bearishly, with the 20 EMA at $2.14 acting as immediate resistance. The Bollinger Bands also began to squeeze earlier this week before expanding on the downside, indicating rising XRP price volatility.
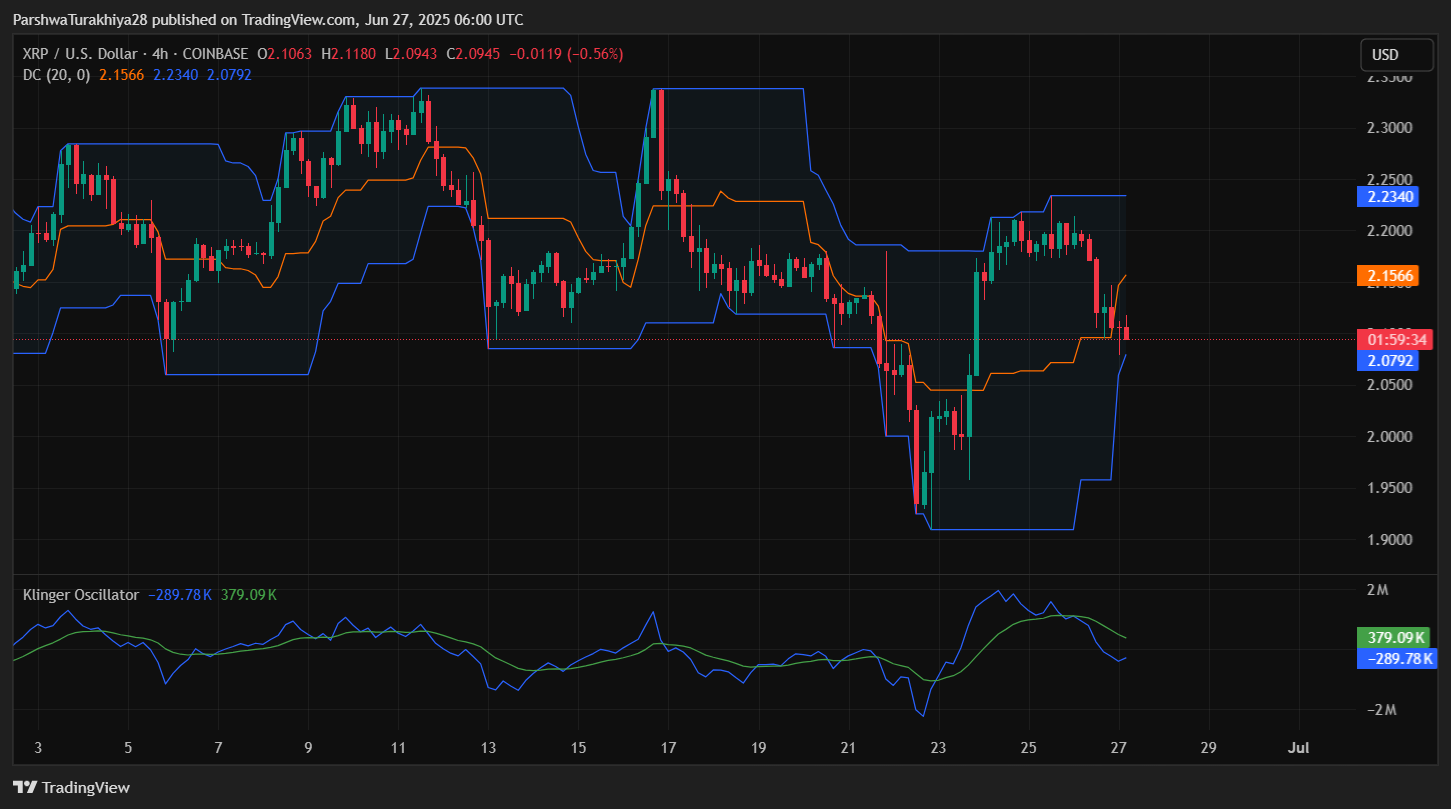
The Klinger Oscillator has crossed below its signal line, confirming a decline in momentum. Meanwhile, the Donchian Channels show price has dropped below the mid-band at $2.15 and is now hovering just above the lower band at $2.08.
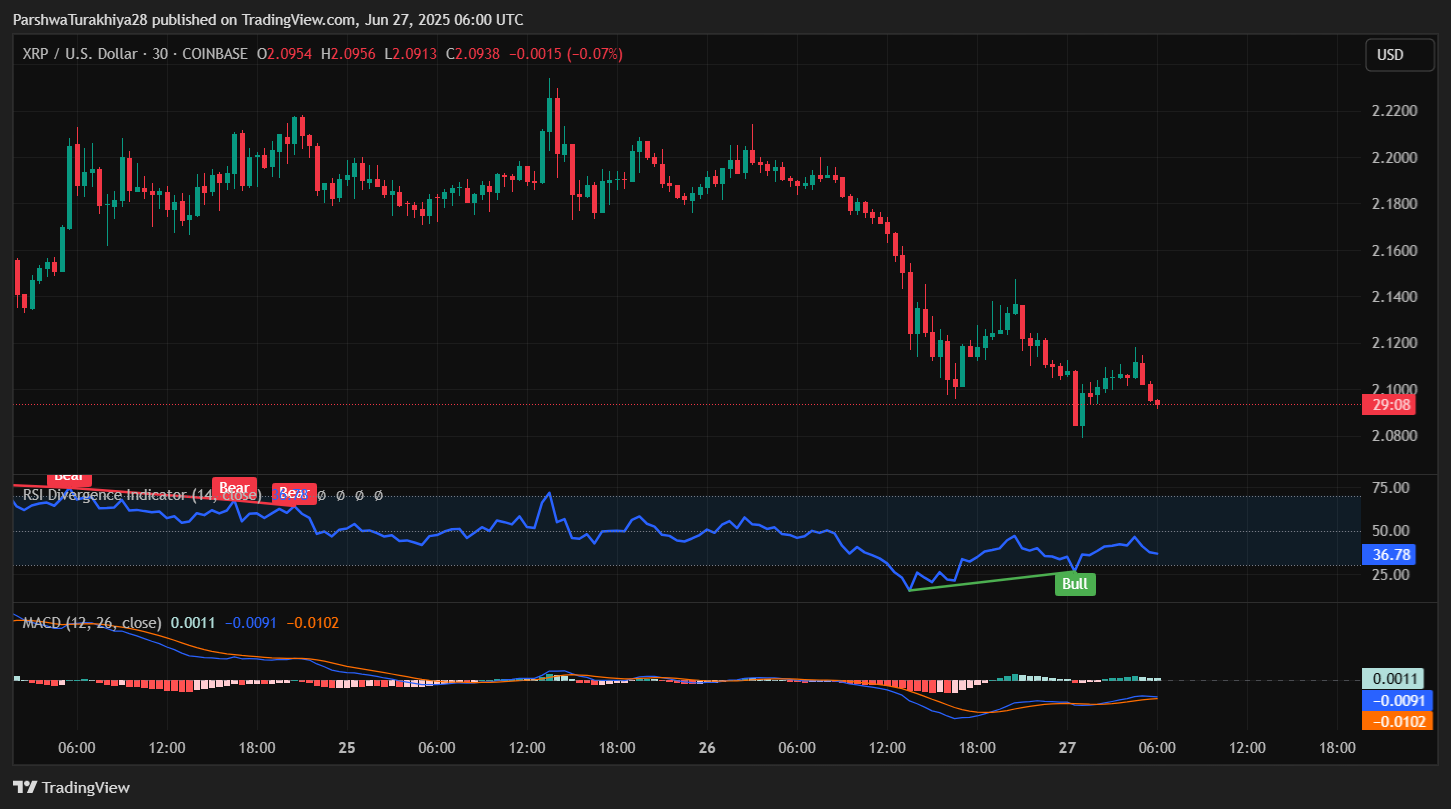
On the 30-minute chart, the RSI is trending around 36, still in the bearish zone but showing slight bullish divergence. The MACD histogram remains in negative territory, with no bullish crossover in sight. Additionally, Parabolic SAR dots continue to print above candles, further supporting the bearish bias in the short term.

Market flows also paint a cautionary picture. Data from June 26 shows a net outflow of $31.12 million from spot markets, reinforcing the bearish pressure and suggesting whales are offloading at resistance levels. This outflow corresponded with the failed breakout above $2.20.
XRP Price Indicators Show Bearish Momentum With Support Tests Ahead
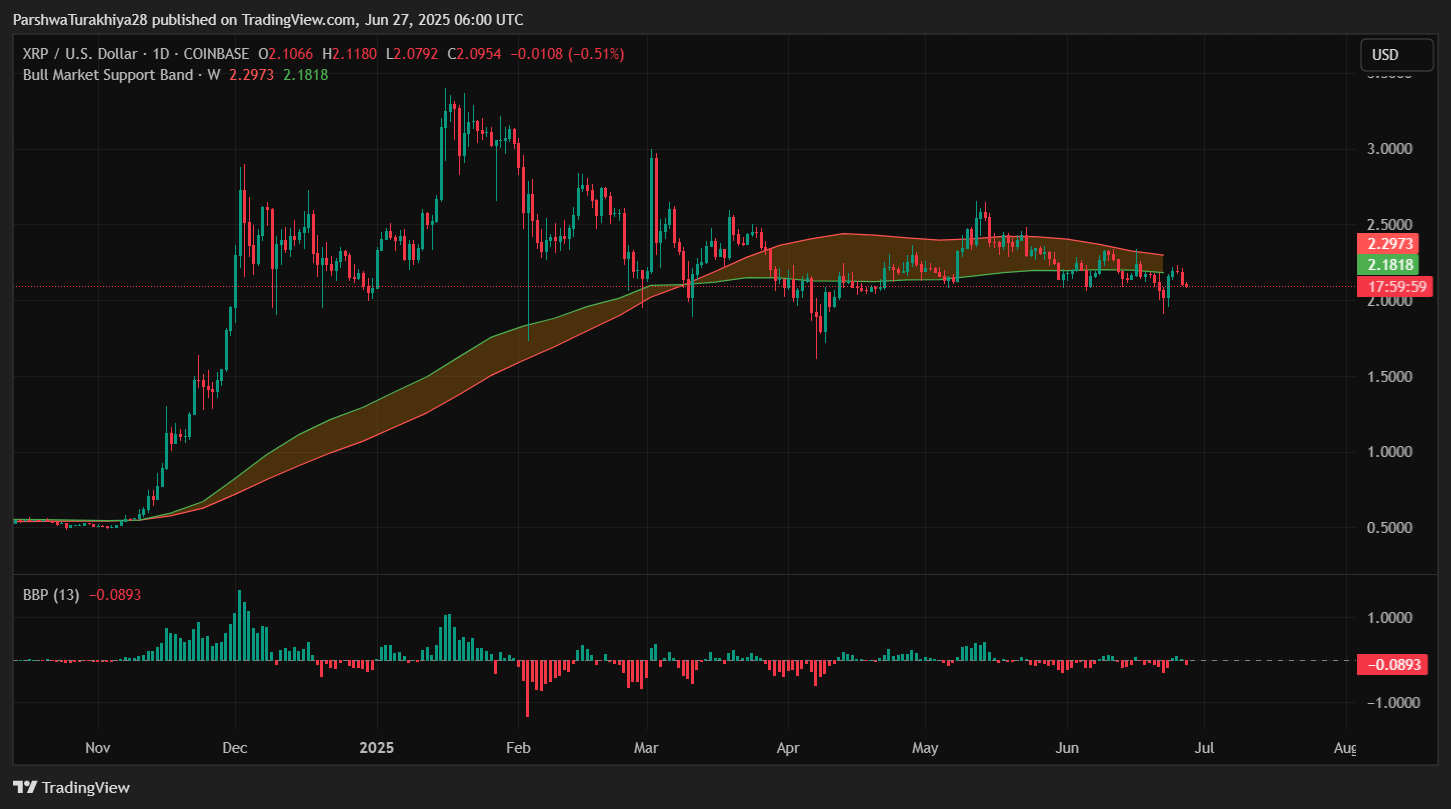
From a broader perspective, the Bull Market Support Band on the weekly chart has started to slope down. XRP now trades below this band, with the upper bound near $2.29 acting as a major ceiling. Unless bulls reclaim this level with volume, a deeper correction remains in play.
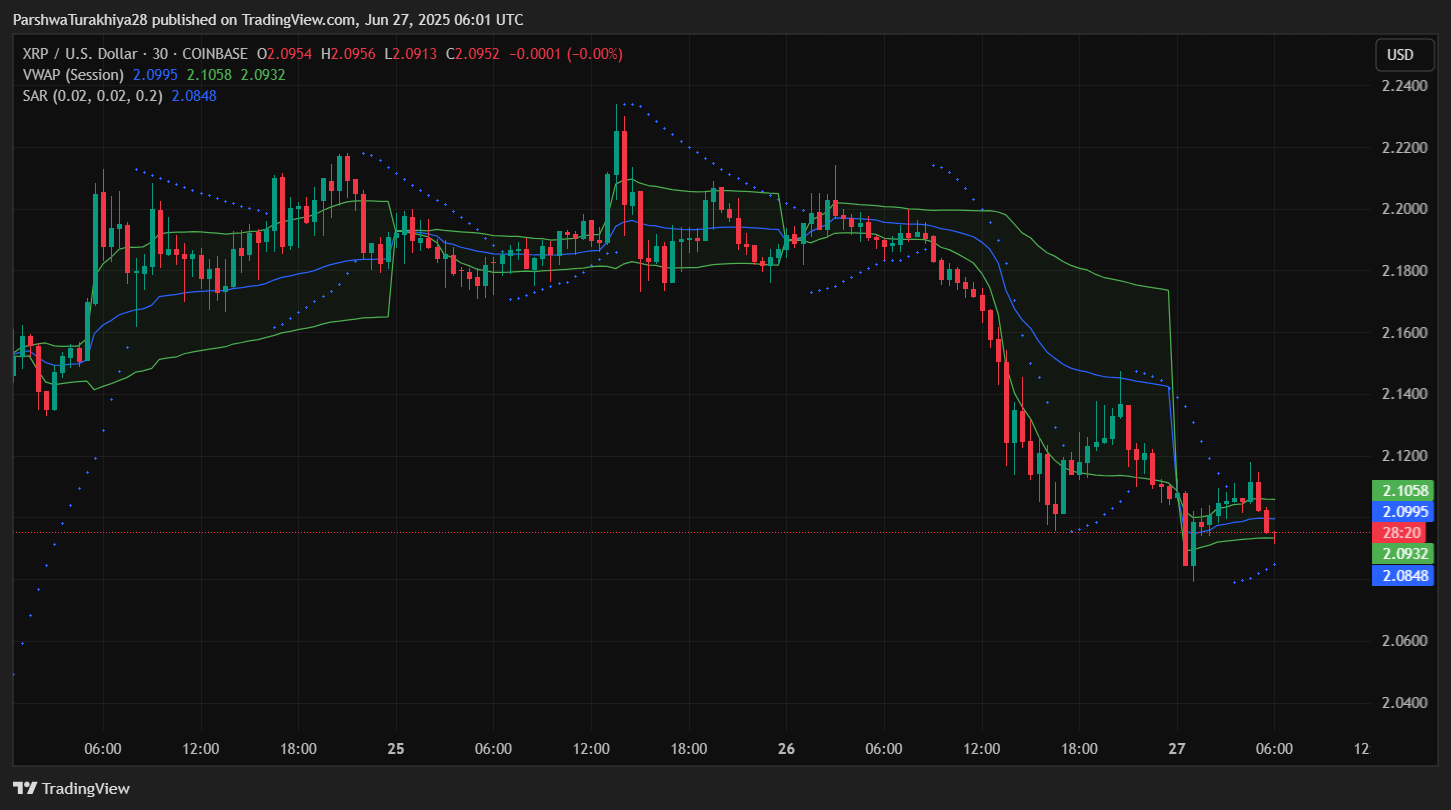
The VWAP (Volume Weighted Average Price) and SAR indicators on the 30-minute chart also confirm weakening momentum. XRP is consolidating below both the session VWAP and middle SAR band, which suggests sellers are dominating short-term control.
Interestingly, the RSI Divergence indicator shows a recent bullish divergence on the 30-minute chart, hinting at the possibility of a short-term bounce if buyers defend $2.08. But this bounce is unlikely to sustain unless the structure flips above $2.20 with conviction.
XRP Price Prediction: Short-Term Outlook (24h)
Looking ahead, the XRP price update suggests that short-term volatility will remain elevated as the asset hovers around a decision point. If XRP breaks decisively below $2.08, expect a retest of $1.95 and possibly $1.80. These zones hold historical support from earlier in 2025 and are marked by visible demand clusters.
On the flip side, if buyers step in and push price back above $2.14 and then $2.20, a relief rally toward $2.32 and $2.45 could unfold. For this scenario to materialize, momentum indicators like RSI and MACD must flip bullish across both the 4H and 30-min charts.
Given the current rejection and lack of strong inflows, the path of least resistance leans slightly bearish unless XRP breaks back above $2.20 with increasing volume and reclaim of the EMA band.
XRP Price Forecast Table: June 28, 2025
| Indicator/Zone | Level (USD) | Signal |
| Resistance 1 | 2.20 | Intraday rejection zone |
| Resistance 2 | 2.32 | Major upside cap |
| Support 1 | 2.08 | Key short-term support |
| Support 2 | 1.95 | Breakdown confirmation |
| RSI (30-min) | 36.78 | Bearish, slight divergence |
| MACD (30-min) | Negative | Weak momentum |
| EMA Cluster (4H) | 2.14–2.22 | Bearishly aligned |
| Bollinger Band Width | Expanding | Elevated volatility |
| Klinger Oscillator | Bearish | Downward pressure building |
| Spot Netflow (June 26) | -$31.12M | Capital outflows from market |
Disclaimer: The information presented in this article is for informational and educational purposes only. The article does not constitute financial advice or advice of any kind. Coin Edition is not responsible for any losses incurred as a result of the utilization of content, products, or services mentioned. Readers are advised to exercise caution before taking any action related to the company.


