





- XRP’s monthly RSI is more oversold than during the March 2020 COVID crash, down 72% from its all-time high per analyst Ash Crypto
- OSL Hong Kong opened XRP retail trading, making it the first exchange in Hong Kong to do so with settlement via the XRP Ledger
- Spot XRP netflow hit -$9.98M on July 29, meaning more XRP left exchanges than entered, a supply-reducing signal despite the price weakness
XRP trades at $1.0873 on July 29, up 1.83%, attempting a bounce inside a descending wedge that has compressed price since the May peak as its monthly RSI sits at the most oversold reading in the token’s history.
XRP Is Still Inside The Descending Wedge With The Supertrend Bearish
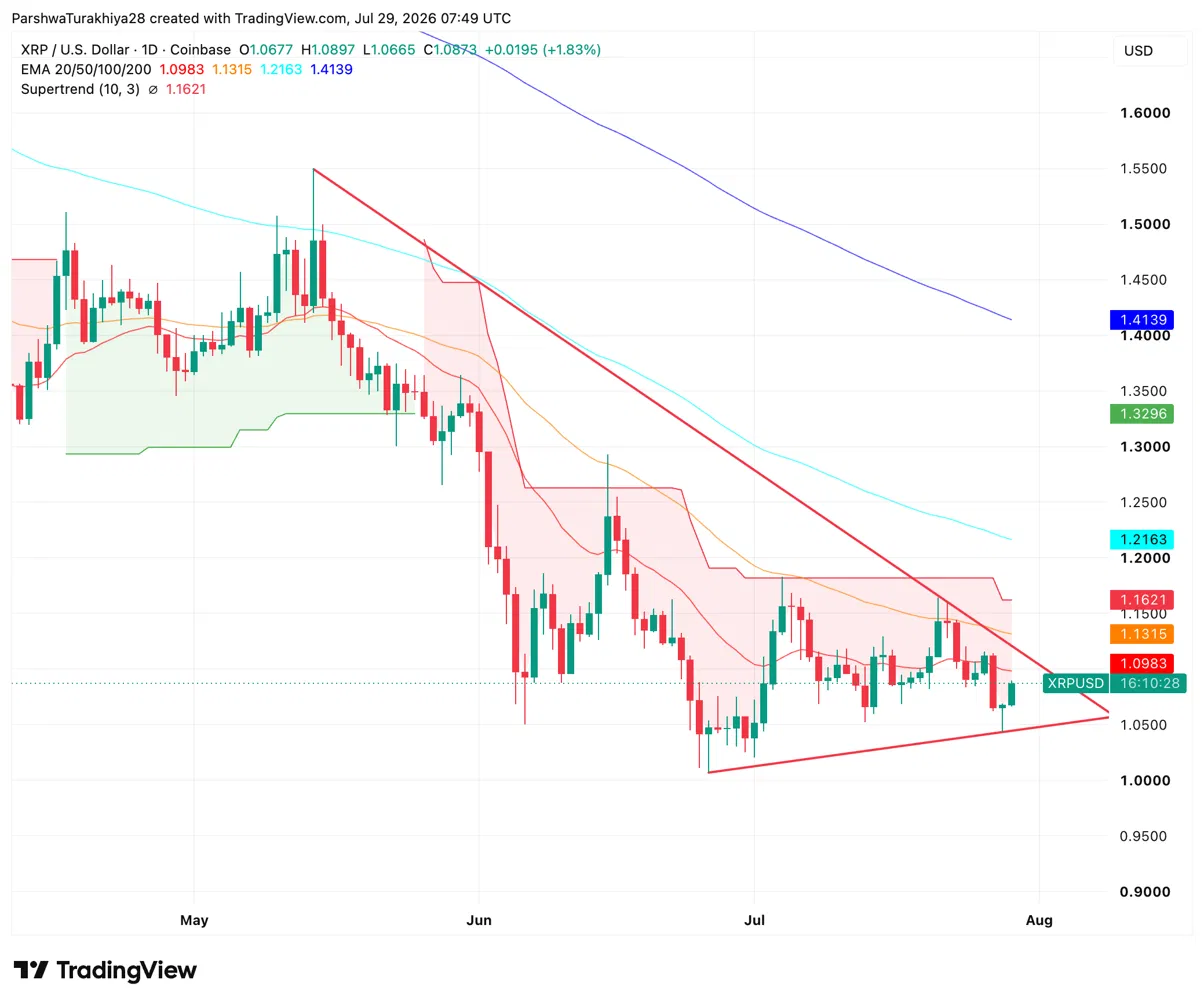
The daily chart shows XRP compressing inside a descending wedge with both trendlines visibly converging. The lower trendline has held through multiple tests near $1.05. Today’s bounce is pressing against the upper trendline near $1.10 to $1.12. The Supertrend at $1.1621 sits bearish above price and is the first indicator that needs to flip for any trend change to be confirmed on the daily timeframe.
All four EMAs slope downward above current price. The 20-day at $1.0983 is the immediate ceiling, sitting almost exactly at current price. The Ichimoku cloud remains bearish above, adding another layer to the overhead resistance stack. The $1.00 round number and the June low define the floor if the wedge breaks lower.
What Are The Key Support And Resistance Levels For XRP Today?
Resistance
- $1.0983 — 20-day EMA, immediate ceiling at current price
- $1.1315 — 50-day EMA
- $1.1621 — Supertrend, needs to flip bullish for trend confirmation
- $1.2163 — 100-day EMA, extended upside target
Support
- $1.0665 — Today’s session low and wedge lower trendline
- $1.0500 — Recent support zone from prior tests of the wedge floor
- $1.0000 — Round number and June low, last floor before uncharted territory
XRP’s Monthly RSI Is More Oversold Than During The COVID Crash
Analyst Ash Crypto flagged on July 28 that XRP’s monthly RSI has reached its most oversold reading in history, surpassing even the March 2020 COVID crash lows. XRP is currently down 72% from its all-time high and touched a two-year low near $1.00 last month.
The monthly RSI reading is a slow-moving signal that takes time to confirm, but historically extreme oversold readings on the monthly timeframe have preceded multi-month recoveries rather than continued straight-line declines. The CLARITY Act delay and Iran geopolitical noise are suppressing near-term momentum, but the monthly signal is the kind that longer-horizon investors track as an accumulation zone indicator.
OSL Hong Kong Opened XRP Retail Trading With XRP Ledger Settlement
OSL Hong Kong became the first exchange in Hong Kong to open XRP trading to retail investors. XRP joins Bitcoin, Ethereum, and Solana as the only four assets available to retail on the platform. Settlement runs directly through the XRP Ledger.
The move expands XRP’s regulated retail access in Asia at a moment when the token is pressing its most oversold monthly RSI levels in history. It adds an institutional demand signal to an on-chain setup that already shows net exchange outflows.
What Spot Netflow And Derivatives Show About Current Positioning
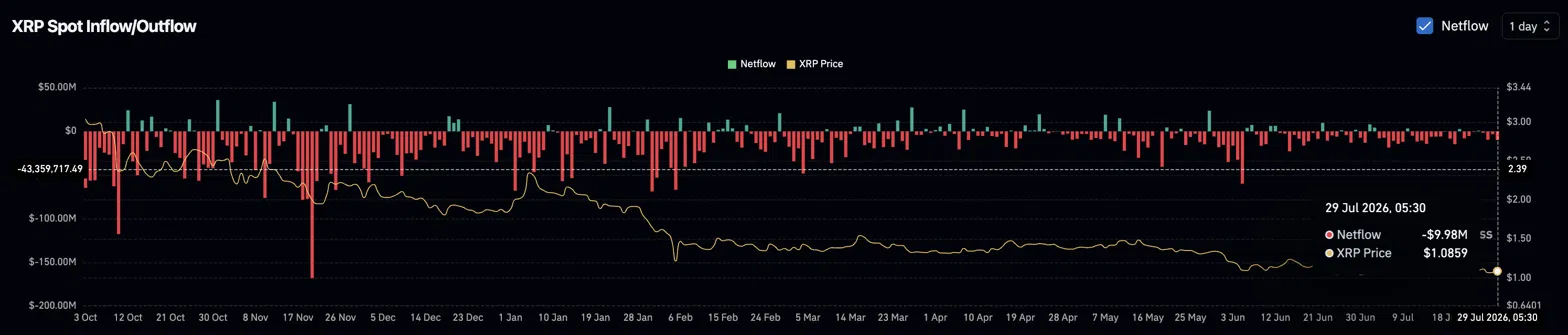
XRP spot netflow registered -$9.98M on July 29, meaning more XRP moved off exchanges than onto them. The netflow chart shows a sustained pattern of net outflows throughout July despite price weakness. Historically, holders removing supply from the sellable float during a price decline is a bullish undercurrent sitting beneath bearish surface price action.
XRP Derivatives Overview — July 29, 2026
| Metric | Value | What It Means |
| 24h Volume | $2.55B (+9.70%) | Active trading without major new directional positioning |
| Open Interest | $2.45B (-0.08%) | Nearly flat, no large new bets being placed |
| Long Liquidations (24h) | $3.60M | Longs absorbing most of the recent volatility |
| Short Liquidations (24h) | $945.84K | Shorts taking far less pain than longs |
| Top Trader L/S (Accounts) | 2.86 | Large accounts firmly net long |
| Top Trader L/S (Positions) | 1.49 | Position sizing also net long |
| Retail L/S Ratio | 1.0421 | Nearly balanced — retail not heavily committed either way |
The retail long/short ratio at 1.0421 is almost exactly balanced, showing smaller traders are not heavily committed in either direction heading into the FOMC decision. That is unusual for a market sitting at historically extreme oversold readings and suggests retail has not yet started chasing the monthly RSI signal.
XRP Price Prediction: Upside and Downside Targets
- Upside case: The wedge upper trendline breaks above $1.10, XRP reclaims the 20-day EMA at $1.0983, OSL Hong Kong retail flows add demand from Asia, and the monthly RSI extreme draws spot accumulation toward the Supertrend at $1.1621 and the 50-day EMA at $1.1315 as the CLARITY Act window narrows to its final days.
- Downside case: The wedge upper trendline rejects price again, XRP loses the lower trendline near $1.05, and the CLARITY Act fails to reach a vote before August 8 recess, sending price toward the $1.00 round number as the most oversold monthly RSI in history stays depressed without a catalyst to trigger recovery.
Disclaimer: The information presented in this article is for informational and educational purposes only. The article does not constitute financial advice or advice of any kind. Coin Edition is not responsible for any losses incurred as a result of the utilization of content, products, or services mentioned. Readers are advised to exercise caution before taking any action related to the company.




