
- XRP is attempting a second breakout above the descending trendline after the first attempt failed in early July
- The 10-week ETF inflow streak is at risk with weekly flows at -$7.29M, pending Friday’s data
- A macro analyst flags an XRP accumulation pattern that previously preceded 1,000%+ rallies
XRP trades at $1.1044 on July 10, up 1.08% and pressing against the descending trendline for the second time this month, with the chart labeling it “Another Breakout Attempt.”
Is XRP’s Second Trendline Breakout Attempt More Convincing?
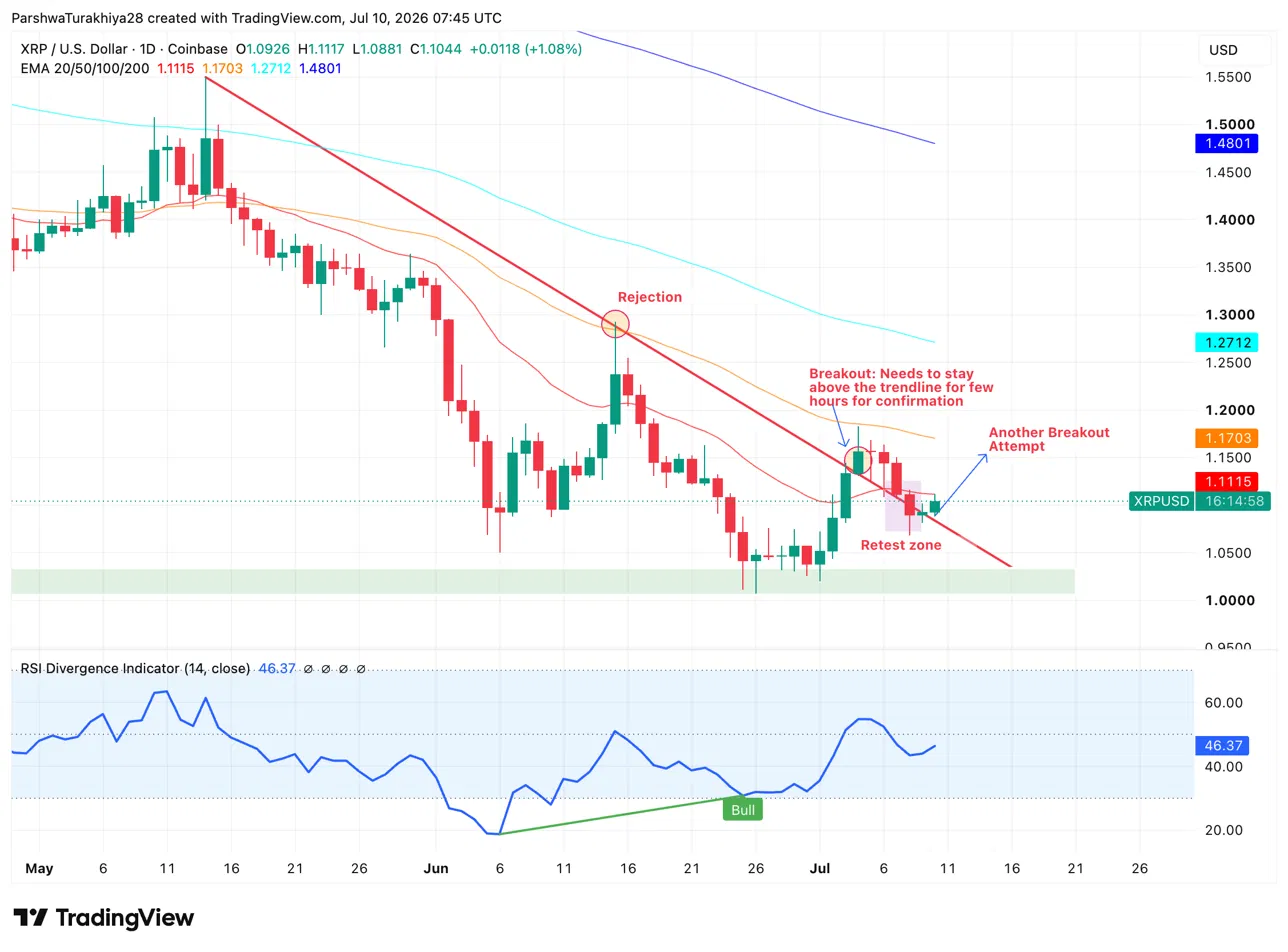
The daily chart shows XRP making a fresh push at the descending trendline that has capped every rally since May, with the chart annotating this move explicitly as another breakout attempt. The first try in early July cleared the line briefly before pulling back into the retest zone, where price has been grinding for the past week. The RSI divergence tool sits at 46.37 with a bullish divergence still active from the June lows, a setup that has not yet fully played out.
Related: Velvet Price Prediction: Velvet Price Jumps 30% as Bulls Eye $0.54 Breakout
Every EMA remains above price: the 20-day at $1.1115 is essentially at spot, the 50-day at $1.1703 is the first meaningful target above, the 100-day at $1.2712 and the 200-day at $1.4801 sit further overhead. A confirmed daily close above the trendline and the 20-day EMA together is the cleaner signal to watch.
What Are The Key Support And Resistance Levels For XRP Today?
- Support at $1.0881 intraday low and the retest zone near $1.08-$1.10
- Resistance at $1.1115 on the 20-day EMA and the trendline, then $1.1703 on the 50-day
What Do XRP Derivatives Show About This Move?
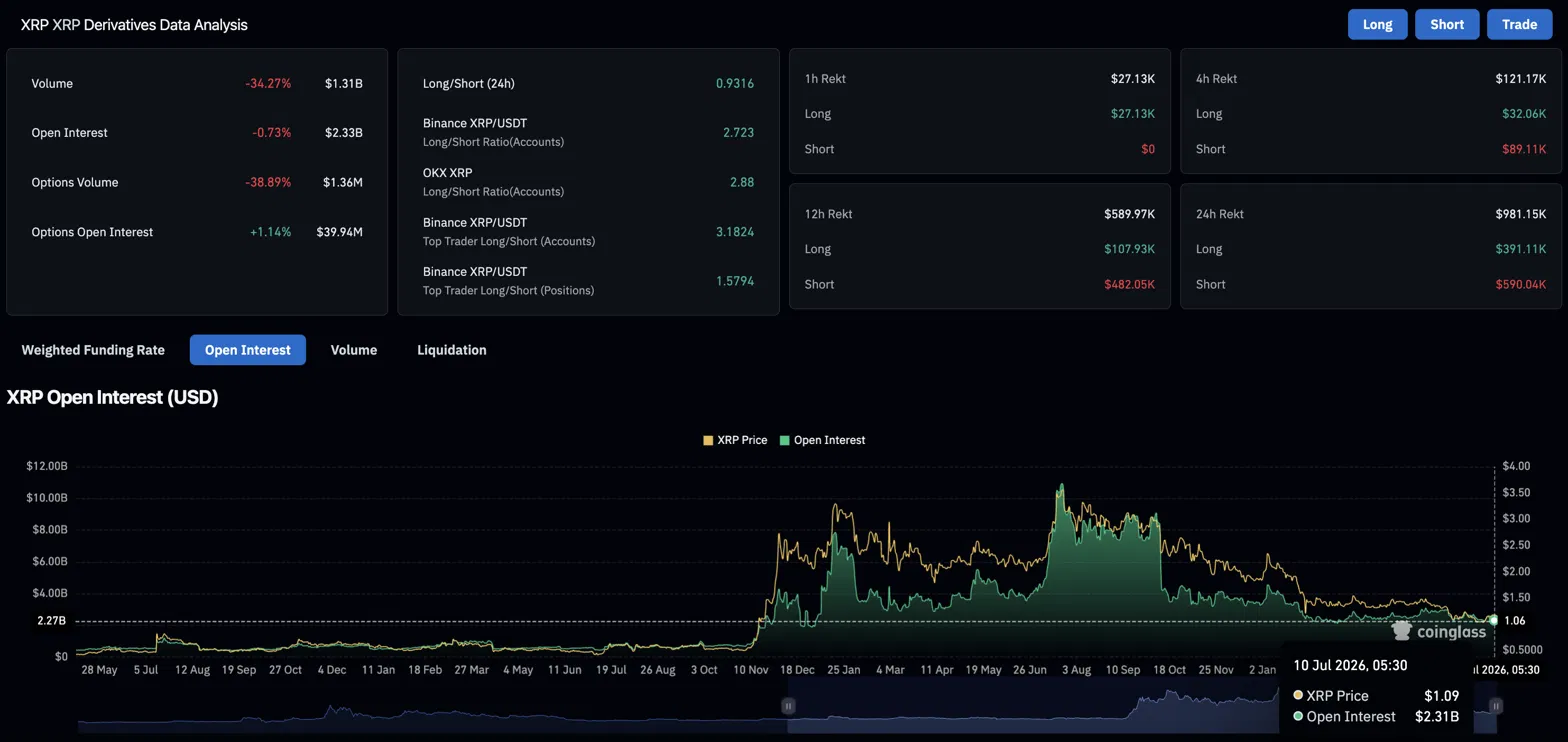
Volume fell 34.27% to $1.31B while open interest slipped 0.73% to $2.33B, both declining quietly as traders step back during the retest. Options volume dropped 38.89% to $1.36M, reflecting a pullback in hedging activity after last week’s spike.
Liquidations over 24 hours hit $981.15K with shorts losing $590.04K against $391.11K for longs, shorts still taking the larger hit even on a relatively quiet day. Over 12 hours, shorts lost $482.05K against $107.93K for longs, and in the past hour longs were the only side liquidated at $27.13K with zero shorts caught. The directional signal from liquidations remains modestly in favor of bulls even as overall activity stays thin.
Is XRP’s 10-Week ETF Inflow Streak About To Break?
The weekly ETF data through July 9 shows net outflows of $7.29M, putting the streak of nine consecutive positive weeks at risk. Friday’s data, which hasn’t yet been reported, will determine whether this week closes negative for the first time in ten weeks. The prior streak held through a period of heavy price weakness, making a first negative weekly close a sentiment data point worth watching even if the cumulative $1.48B in inflows remains intact.
Related: Cardano Price Prediction: Hoskinson Calls Ethereum’s EUTXO Move a Crime as ADA Holds the 20-Day EMA
Ripple’s MiCA authorization across 30 European countries, confirmed last week, keeps longer-term institutional interest supported, though the session’s moves are being driven by technical levels rather than fresh regulatory news.
What Is The Macro Pattern Analysts Are Watching On XRP?
Analyst Crypto Patel flagged an XRP higher timeframe accumulation pattern between $0.70 and $1.10 that has historically preceded 1,000%+ expansion moves. The setup shows MACD near a bullish crossover on the macro chart, with $3 as the key resistance to clear and $9 as the longer-term target if the demand zone holds and structure breaks higher.
This is a long-horizon read rather than a near-term call, but it frames why the $1.00-$1.10 zone has drawn consistent buyer interest despite the broader downtrend.
XRP Price Prediction: Upside and Downside Targets
- Upside case: The second breakout attempt holds with a daily close above $1.1115, Friday ETF data confirms the streak survives, and XRP targets $1.1703 on its way to $1.2712.
- Downside case: The trendline rejects price again, the ETF streak breaks for the first time in ten weeks, and XRP slips back toward the retest zone near $1.05.
Related: ApeCoin (APE) Price Prediction 2026, 2027, 2028, 2029, 2030-2050
Disclaimer: The information presented in this article is for informational and educational purposes only. The article does not constitute financial advice or advice of any kind. Coin Edition is not responsible for any losses incurred as a result of the utilization of content, products, or services mentioned. Readers are advised to exercise caution before taking any action related to the company.