


- XRP price prediction stays bearish below $1.35, with $1.25 the key support
- Ripple says the OCC granted final approval to Ripple National Trust Bank
- Ali Charts flags a TD Sequential buy signal on XRP’s 3-day chart, with $1.25 the level to hold
XRP price prediction for October 29 stays bearish below $1.35, the level XRP needs to reclaim while it holds above the $1.25 support.
XRP Price Analysis: Can XRP Reclaim $1.35 After Its Bounce?
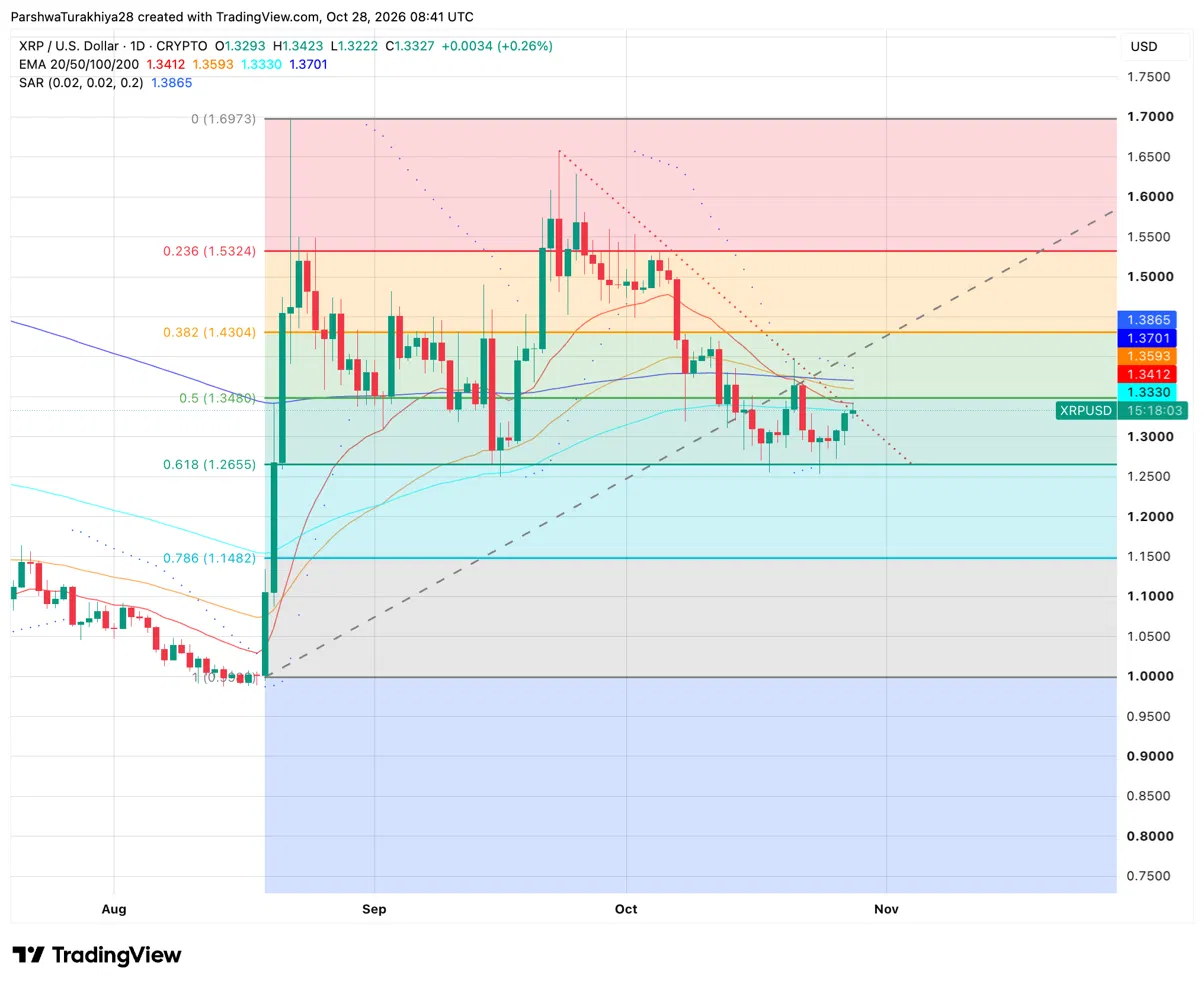
XRP is trading at $1.33, up 0.26% on the day, with resistance close above. A daily close above $1.35 would strengthen the recovery, though buyers would still face several hurdles.
Price is holding near the 100-day EMA at $1.33, just below the 20-day EMA at $1.34. The 0.5 Fibonacci level adds resistance at $1.35, followed by the 50-day EMA at $1.36 and the 200-day EMA at $1.37. The Parabolic SAR sits higher at $1.39.
XRP is also testing a falling trendline from the late-September high. Above that, the rising trendline from the August low now sits near $1.40. XRP fell below this line earlier in the month, making it another level buyers need to reclaim.
If the bounce fades, the next support is the 0.618 Fibonacci level at $1.27. A daily close below it would bring $1.25 into focus, a level also highlighted by Ali Charts.
Related: Cardano Price Prediction: Can ADA Hold $0.20 as Traders Wait on the FOMC Meeting?
Heading into October 29, $1.35 remains the first key test. A close above it would open the way toward 1.36–1.39, while another rejection would leave XRP vulnerable to a pullback.
XRP Support and Resistance Levels, October 28, 2026
| Type | Price | Why it matters |
| Resistance | $1.35 | 0.5 Fibonacci level, above the 20-day EMA |
| Resistance | $1.39 | Parabolic SAR |
| Resistance | $1.43 | 0.382 Fibonacci level |
| Support | $1.33 | 100-day EMA |
| Support | $1.27 | 0.618 Fibonacci level |
| Support | $1.25 | Key level flagged by Ali Charts |
Ripple Brings Its Infrastructure to Robinhood and Wins Final OCC Approval for Its Trust Bank
Ripple CEO Brad Garlinghouse (@bgarlinghouse) said in a post on X that Ripple opened its Swell conference, which marks 10 years of the event, with a series of announcements. He added that more news was coming that week.
- Robinhood: Ripple’s infrastructure will support both customer-facing services and core financial operations at Robinhood, from RLUSD settlement on the XRP Ledger to prime brokerage and treasury operations. RLUSD is Ripple’s stablecoin.
- BNY: Ripple is expanding its relationship with BNY across custody and tokenized trade finance using RLUSD, XRP and the XRP Ledger.
- Ripple Treasury: A new product called 24/7 Returns lets corporates put idle cash to work outside banking hours using stablecoins.
- Trust bank: The OCC, the US national bank regulator, granted final approval for Ripple National Trust Bank.
Ali Charts Flags $1.25 as the Level XRP Must Hold After a TD Sequential Buy Signal
Ali Charts (@alicharts) said a TD Sequential buy signal has flashed on XRP’s 3-day chart. TD Sequential counts consecutive candles to flag when a move may be running out of steam.
Related: MemeCore Price Prediction: Can M Reach $1.35 or Fall to $1.02 This Week?
The last three similar signals were followed by rebounds of 31%, 24% and 18%, though he said everything depends on $1.25. In a separate thread he described a possible inverse head and shoulders on the daily chart, a bottoming pattern, with its right shoulder forming near that same support.
- If $1.25 holds: XRP could rebound toward $1.40, and then toward the $1.55 neckline of the pattern.
- If XRP closes above $1.55 on the daily chart: A breakout toward $2.10 could follow.
- If $1.25 breaks: $0.98 comes into focus, and he warned of that risk if whales keep taking profits.
XRP Price Prediction: Bullish and Bearish Scenarios for October 29
Bullish Case, Target: $1.40
XRP holds above $1.25, closes above the 20-day EMA at $1.34 and the 0.5 Fibonacci level at $1.35, then clears the 50-day and 200-day EMAs at $1.36 and $1.37 and the Parabolic SAR at $1.39. That would open $1.40, the rebound level Ali Charts ties to the TD Sequential signal, with the 0.382 Fibonacci level at $1.43 above it. The inverse head and shoulders setup he describes would fit this path.
Bearish Case, Risk Level: $1.25 (Key Support)
XRP loses the 100-day EMA at $1.33 and slides through the 0.618 Fibonacci level at $1.27 toward $1.25. A daily close below that level would bring $0.98, the next level Ali Charts names, into view, and the whale profit taking he warns about would fit this path.
Related: Zcash Price Prediction: ZEC Rally Faces Pressure as Co-Founder Proposes Ending Grants Funding
FAQs
XRP stays bearish below $1.35 and could rebound toward $1.40 if it closes above that level and clears the averages up to the Parabolic SAR at $1.39. A daily close below $1.25 would put $0.98 in view.
$1.25 is the key support, according to Ali Charts, and it sits just below the 0.618 Fibonacci level at $1.27. The 100-day EMA at $1.33 is the nearest support above both.
Ripple CEO Brad Garlinghouse said Ripple is bringing its infrastructure to Robinhood, expanding its work with BNY on custody and tokenized trade finance, and launching 24/7 Returns for corporate treasuries. He also said the OCC granted final approval for Ripple National Trust Bank.
Ali Charts says TD Sequential flashed a buy signal on XRP’s 3-day chart, and the last three similar signals were followed by rebounds of 31%, 24% and 18%. He says the signal depends on $1.25 holding, and that losing it could send XRP toward $0.98.
Disclaimer: The information presented in this article is for informational and educational purposes only. The article does not constitute financial advice or advice of any kind. Coin Edition is not responsible for any losses incurred as a result of the utilization of content, products, or services mentioned. Readers are advised to exercise caution before taking any action related to the company.