


- XRP trades at $1.2394 after a 10% rally from $1.14 that briefly touched $1.25 before sellers stepped in
- XRP spot ETFs pulled $2.82M on June 15 marking a second straight week of inflows at $10.68M total
- South Korea’s Upbit accounted for 31% of XRP wallet-flow activity by June 14, up from 13% a week prior
XRP trades at $1.2394 on June 16, pulling back after briefly clearing $1.25 on volume that surpassed 180 million XRP. The breakout above $1.20 was real but sellers showed up fast, leaving the market focused on whether former resistance holds as support rather than how far the rally extends.
XRP Daily Chart: $1.20 Broken but $1.2440 Is Still the Level to Watch
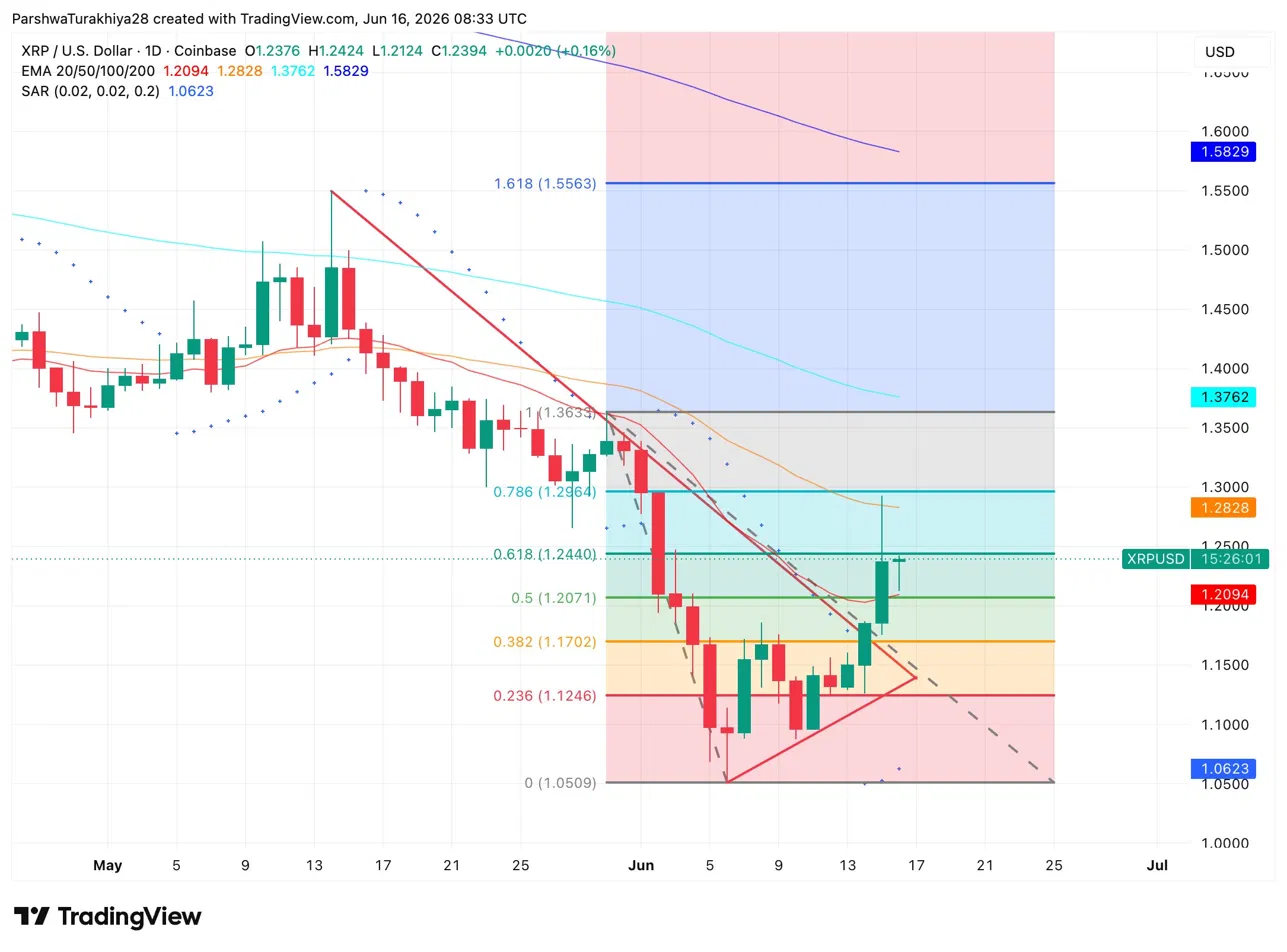
The daily chart shows XRP recovering from the June cycle low at $1.0509 and pressing through the 0.618 Fibonacci level at $1.2440, which has capped every meaningful recovery attempt since the May breakdown. Price closed above $1.20 for the first time in weeks, but the session high near $1.25 ran straight into the 0.618 zone and retreated.
Related: Stellar (XLM) Price Prediction: Can Bulls Extend the Breakout Toward $0.25?
The SAR at $1.0623 sits well below price confirming the daily trend has shifted bullish. All four EMAs remain overhead as resistance: 20 at $1.2094, 50 at $1.2828, 100 at $1.3762, and 200 at $1.5829. The 20 EMA at $1.2094 has flipped to support for the first time since May, which is the most important structural change on this chart.
XRP Key Levels for June 17
- Resistance: $1.2440 (0.618 Fib), $1.2964 (0.786 Fib)
- Support: $1.2094 (20 EMA), $1.2071 (0.5 Fib)
Korean Demand and ETF Inflows Drove the Breakout
South Korea’s Upbit accounted for 31% of XRP wallet-flow activity by June 14, up sharply from 13% just one week earlier. That regional demand surge combined with XRP spot ETF inflows of $2.82M on June 15 created the volume needed to push through $1.20.
The breakout candle exceeded 180 million XRP in volume, clearing the resistance zone convincingly before profit-taking arrived near $1.25. XRP ETFs recorded a second consecutive week of positive flows totaling $10.68M. Cumulative inflows now stand at $1.44B. Bitwise led June 15 with $1.43M and Franklin contributed $1.39M.
XRP Spot Inflow Data Shows Net Positive Flow on June 16
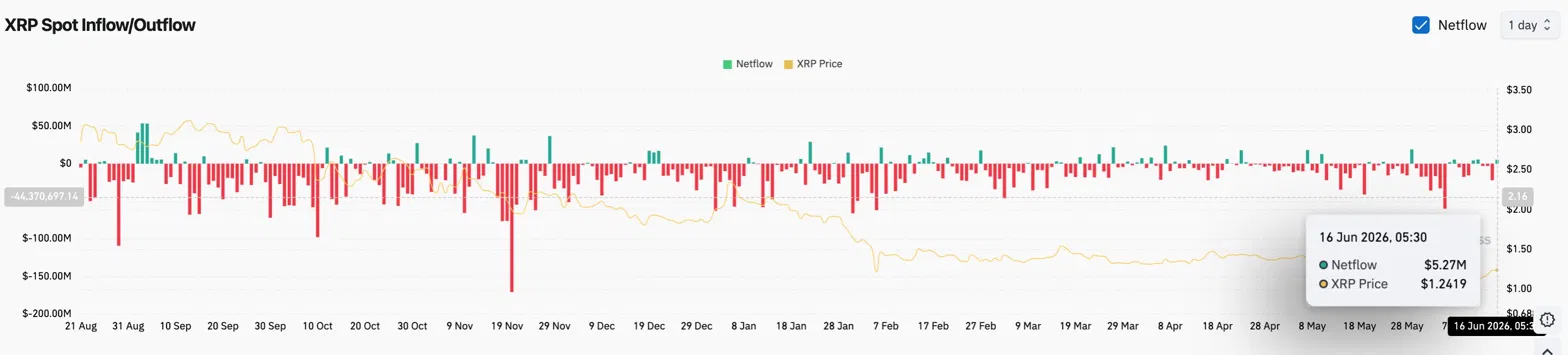
The spot inflow chart shows a $5.27M net positive flow into XRP on June 16, one of the cleaner green readings in recent weeks.
Related: Cardano Price Prediction: ADA Posts First Green Week Since May as Hoskinson ICO Controversy Heats Up
Dominant red bars throughout May and early June reflect the sustained selling pressure that pushed XRP to $1.05. The shift to green alongside the $1.20 breakout confirms the demand picture is changing.
XRP Derivatives: Volume More Than Doubled and Shorts Are Getting Hit
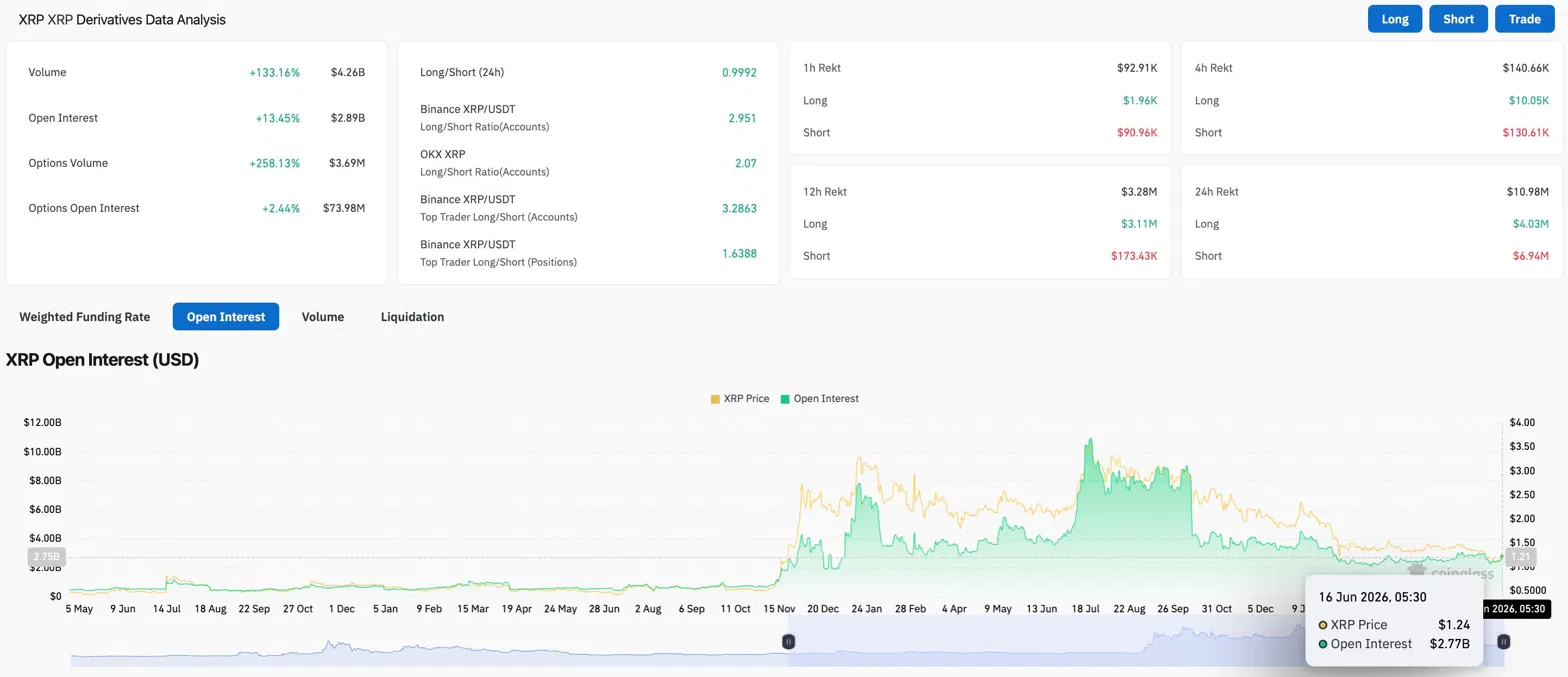
Volume surged 133.16% to $4.26B while open interest jumped 13.45% to $2.89B. Both rising sharply together means fresh money is entering the move, not just position closures. Options volume exploded 258.13% to $3.69M, pointing to traders positioning for a defined directional move.
Over 24 hours, $6.94M in short positions were liquidated against $4.03M in longs. Shorts absorbed more pain but the gap is narrowing, suggesting the squeeze energy from the initial $1.20 breakout is partially exhausted. The long/short ratio of 0.9992 sits at dead neutral.
XRP Price Prediction: Upside and Downside Levels for June 17
- Upside: A daily close above $1.2440 confirms the 0.618 Fibonacci flip and targets $1.2964. Continued Korean demand and ETF inflows into the FOMC decision on June 17 keep that scenario live.
- Downside: A rejection at $1.2440 and close below $1.2094 puts the 20 EMA at risk. Losing that level reopens the path toward the 0.5 Fibonacci at $1.2071 and potentially back to $1.1702 if macro turns hawkish post-FOMC.
Related: Jito Price Prediction: JTO Surges Over 24% as It Eyes a Move Toward $1
Disclaimer: The information presented in this article is for informational and educational purposes only. The article does not constitute financial advice or advice of any kind. Coin Edition is not responsible for any losses incurred as a result of the utilization of content, products, or services mentioned. Readers are advised to exercise caution before taking any action related to the company.


