


- XRP has been on a downfall with its current price hitting $0.3495.
- The coin has flipped by 25.9% in the past week.
- XRP holds the same pattern it had in May, indicating a possible spike for the coin.
The crypto market has been in a doldrum after the price of the major coins precipitated in context to the fall of the FTX exchange. However, the crypto market reflected a green candle in intraday trading. XRP is one of the coins that showed a green candle today. The coin exchanged hands at $0.3495, with a 0.9% plunge in the past 24 hours.
Among the top fifteen coins by market cap, XRP is the most decoupled coin in the past seven days with a 25.9% dip. Like all other coins, XRP started slumping on November 5 and went steeply down to $0.3168 on November 9.
Although at press time, the coin holds a green candle indicating a potential hike, its lower tick is near the $0.3168 support zone or the lowest price XRP hit on November 9. Also, the current green candle has not yet risen above the past day’s price, making the price uncertain.
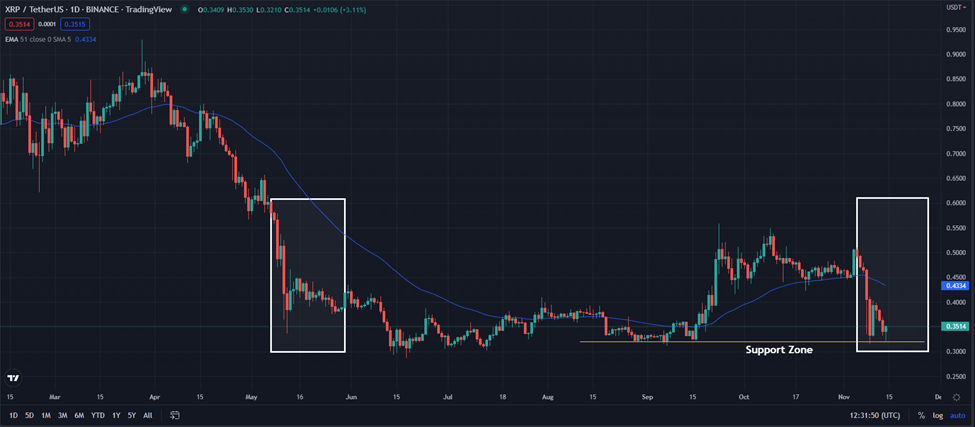
There are two similar rectangle boxes on the one-day trading graph of XRP. These depict that the current trading pattern of XRP resembles the one in May 2022. This signifies that the coin could have a possible surge after the current travail.
Moreover, XRP is currently in a key fluctuating position because its green candle has touched the $0.3210 support zone. If the coin dives below this zone, it could meet another support at $0.2270. On the contrary, if XRP moves up, it could clock above the $3530 resistance level.
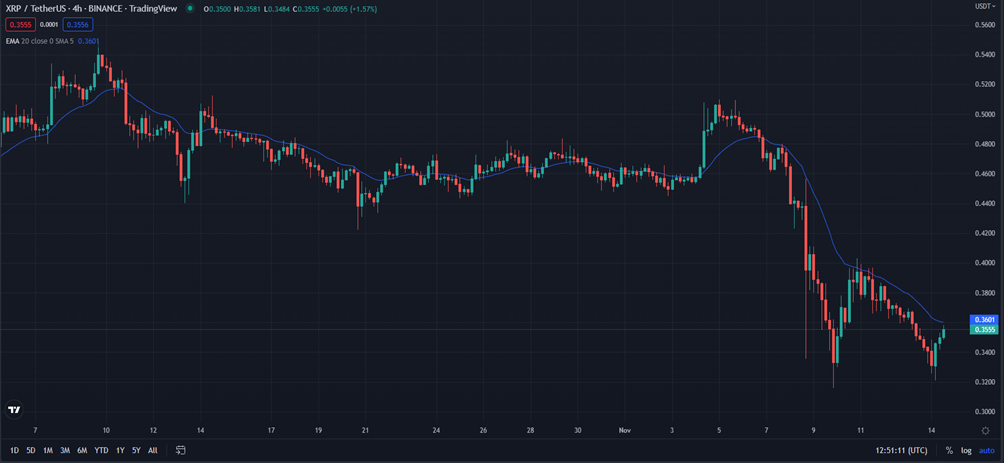
Significantly, XRP in the 4-hour trading chart defeated the $0.3490 support and climbed over the zone, holding the green wave. Also, the 20-day EMA is a quintessential point for the coin as it is currently close to the EMA line.
Disclaimer: The views and opinions, as well as all the information shared in this price prediction, are published in good faith. Readers must do their research and due diligence. Any action taken by the reader is strictly at their own risk. Coin Edition and its affiliates will not be held liable for any direct or indirect damage or loss.
Disclaimer: The information presented in this article is for informational and educational purposes only. The article does not constitute financial advice or advice of any kind. Coin Edition is not responsible for any losses incurred as a result of the utilization of content, products, or services mentioned. Readers are advised to exercise caution before taking any action related to the company.


