






- XRP tests the $1.13-$1.14 resistance after recovering from the recent $1.11 decline.
- XRP ETFs recorded a ninth straight week of inflows, adding $17.19 million to the market.
- MACD turned bullish while RSI recovered to 48.99, showing improving short-term momentum.
XRP continued to recover from its recent decline, but the rebound remained incomplete as the token struggled to break last week’s gains into a breakout. After falling toward $1.11, buyers returned and pushed the price back toward a key resistance zone.
However, the recovery lost momentum before XRP could establish a move above nearby resistance, leaving the market focused on whether the $1.13 to $1.14 area will hold as support or continue to cap further advances.
At the time of writing, XRP traded at $1.12, down by 1.51% over the previous 24 hours. The daily trading volume stood at $1.80 billion, while its market capitalization reached $69.99 billion, keeping the token ranked sixth by market value.
XRP Faces Key Resistance Despite Positive Market Developments
Recent market changes have coincided with XRP’s attempt to regain strength. Spot XRP exchange-traded funds recorded a ninth consecutive week of net inflows, attracting $17.19 million despite ongoing regulatory uncertainty.
At the same time, one anticipated catalyst failed to materialize after a scheduled Senate vote on the CLARITY Act was canceled before the congressional recess. The delay removed a potential near-term event that market participants had been monitoring.
Technical analysts also continued tracking XRP’s long-term descending trendline, identifying the $1.14 to $1.18 region as the next important resistance area. Some analysts noted bullish divergence developing from the recent $1.02 low, while others pointed to a possible Elliott Wave structure.
Technical Indicators Show Increased Short-Term Momentum
The Moving Average Convergence Divergence (MACD) indicator turned positive after the MACD line rose to -0.0147, crossing above the signal line at -0.0300. The resulting positive histogram reading of 0.0153 reflected increasing buying momentum over recent sessions.
Although both MACD lines remained below the zero line, the expanding positive histogram suggested that bullish momentum had strengthened compared with previous trading periods. A move above zero would provide additional confirmation that momentum is shifting.
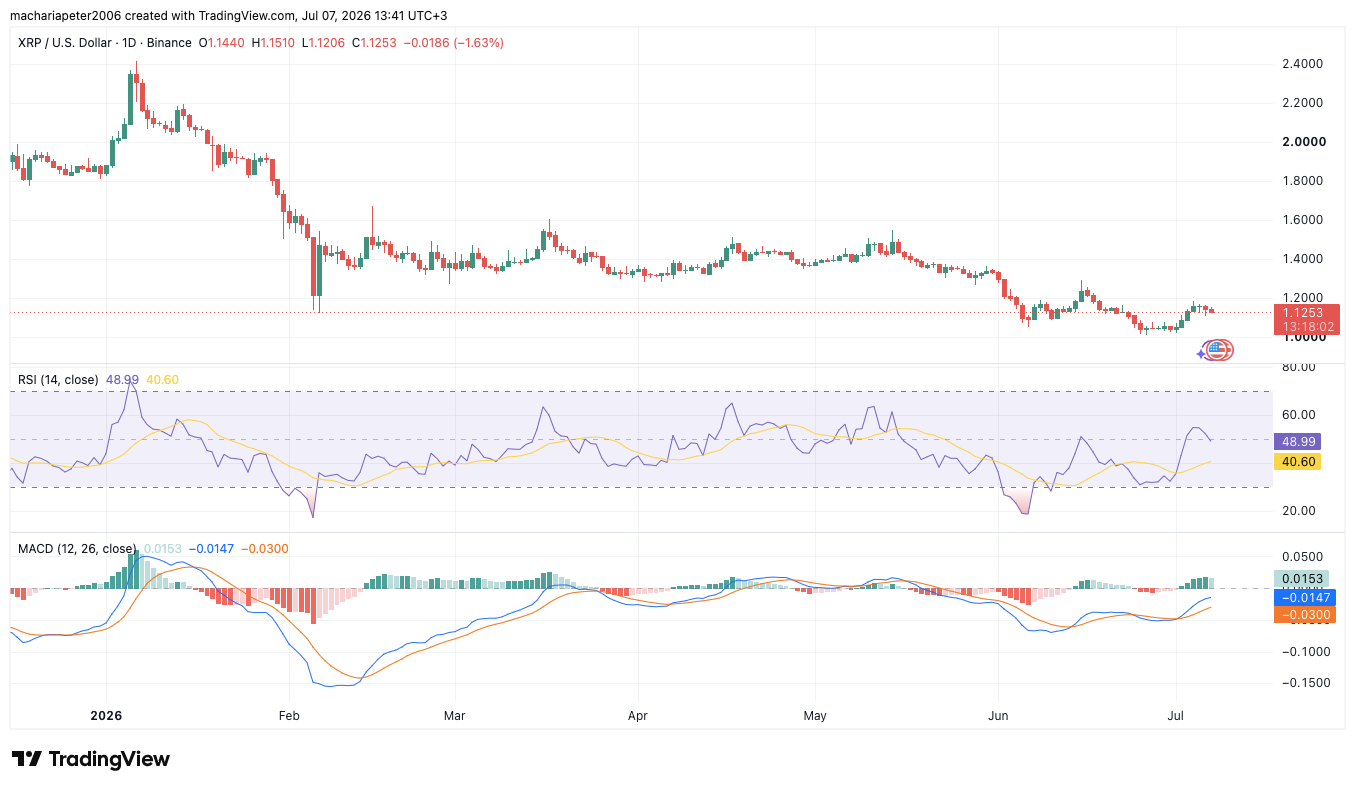
In addition, the Relative Strength Index recorded a rise without indicating excessive buying activity. The 14-day RSI stood at 48.99, while its moving average measured 40.60. The indicator’s position near the midpoint suggested XRP had recovered from earlier oversold conditions without entering overbought territory.
With the RSI remaining above its signal average but still below the 50-55 resistance range, the indicator suggests additional buying activity may be needed before confirming a stronger upward move.
Related: Q3 XRP Outlook: Weekly Patterns Suggest Next Move Could Be Bullish
Disclaimer: The information presented in this article is for informational and educational purposes only. The article does not constitute financial advice or advice of any kind. Coin Edition is not responsible for any losses incurred as a result of the utilization of content, products, or services mentioned. Readers are advised to exercise caution before taking any action related to the company.




